

Virtual 3D modeling of the ammonoid conch to study its hydrostatic properties
DANIEL A. MORÓN-ALFONSO, DAVID J. PETERMAN, MARCELA CICHOWOLSKI, RENÉ HOFFMANN, and ROBERT E. LEMANIS
Morón-Alfonso, D.A., Peterman, D.J., Cichowolski, M., Hoffmann, R., and Lemanis, R.E. 2020. Virtual 3D modeling of the ammonoid conch to study its hydrostatic properties. Acta Palaeontologica Polonica 65 (3): 467–480.
Computed tomography has provided a wealth of biological data that now stands beside a vast, more traditional, morphometric database. By exploiting these two resources, we present a novel methodology to construct intricate, virtual cephalopod shells. As a case of study, we applied this method to Maorites seymourianus using data obtained from a previous work. For this purpose, evaluation of the conch geometry, and the definition of new parameters such as the segment width expansion rate (SWER), segment height expansion rate (SHER), the segment thickness expansion rate (STER), and three indices related, were introduced. The conch geometry of M. seymourianus follows a spiral that can be defined by a polynomial function. While similar to a logarithmic function, a polynomial fit is preferred because it reveals higher values of whorl expansion at the early ontogenetic phase and lower values reaching the adult body chamber. Results on the hydrostatic properties of the virtual models indicate that M. seymourianus would have a near neutral buoyancy, ranging from slightly positive to slightly negative, depending upon parameters that influence organismal mass. Positions of the center of mass and the center of buoyancy indicate that the studied species would have a relatively low hydrostatic stability, estimating a shell orientation of approximately 74–76° with respect to the vertical, with the aperture slightly inclined downwards relative to the horizontal plain.
Key words: Cephalopoda, Ammonoidea, virtual modeling, 3D, conch, CT-scan, morphometry, Cretaceous, Antarctica.
Daniel A. Morón-Alfonso [paleokarzis@gmail.com], Universidad de Buenos Aires, Facultad de Ciencias Exactas y Naturales, Departamento de Ciencias Geológicas, Área de Paleontología, Ciudad Universitaria, Pab. 2, C1428EGA, Buenos Aires, Argentina. CONICET-Universidad de Buenos Aires, Instituto de Estudios Andinos “Don Pablo Groeber” (IDEAN), Buenos Aires, Argentina.
David J. Peterman [peterman.10@wright.edu], Department of Earth and Environmental Sciences, Wright State University, 46 3640 Colonel Glenn Hwy, Dayton, OH 45435, USA.
Marcela Cichowolski [mcicho@gl.fcen.uba.ar], Universidad de Buenos Aires, Facultad de Ciencias Exactas y Naturales, Departamento de Ciencias Geológicas, Área de Paleontología, Ciudad Universitaria, Pab. 2, C1428EGA, Buenos Aires, Argentina. CONICET-Universidad de Buenos Aires, Instituto de Estudios Andinos “Don Pablo Groeber” (IDEAN), Buenos Aires, Argentina.
René Hoffmann [Rene.Hoffmann@rub.de], Institute of Geology, Mineralogy, & Geophysics, Ruhr-Universität Bochum, 44801 Bochum, Germany.
Robert E. Lemanis [robert_evan.lemanis@tu-dresden.de], BCUBE-Center for Molecular Bioengineering, Technische Universität Dresden, Dresden, 01307, Germany.
Received 26 May 2020, accepted 13 July 2020, available online 12 August 2020.
Copyright © 2020 D.A. Morón-Alfonso et al. This is an open-access article distributed under the terms of the Creative Commons Attribution License (for details please see http://creativecommons.org/licenses/by/4.0/), which permits unrestricted use, distribution, and reproduction in any medium, provided the original author and source are credited.
Introduction
Among all the geometries that we can observe in nature, the spirals of modern and fossil cephalopod conchs, such as ammonoids and nautiloids, are among the most popular topics involving biological form (Thompson 1917; Raup 1967; Meinhardt 1995; Hammer 2016). Regarding ammonoids, their originally aragonitic shells are frequently the only available record, except for very rare findings of soft tissue remains (Tanabe and Fukuda 2010; Klug et al. 2012; Klug and Lehmann 2015). Most studies related to the ammonoid conch focus on defining the taxonomy and systematics of the group (e.g., Hoffmann 2010; Parent et al. 2012; Bardin et al. 2014; Knauss and Yacobucci 2014; Klug et al. 2015). However, the conch is also related to the palaeoecology of the group, not only functioning as protection against predators, but also serving as their principal buoyancy device through the phragmocone. Internally, the phragmocone forms a complex structure divided into chambers enclosed by septa with various degrees of folding. In cephalopods, these chambers are connected by a tube called the siphuncle which is composed of mineral layers and organic tissues, allowing the organism to regulate the fluid contained within the chambers (Mutvei and Dunca 2007; Kulicki et al. 2015; Tanabe et al. 2015). The equilibrium between the fluids (gases and intra-cameral liquid) inside the phragmocone and the seawater determined its hydrostatic properties (e.g., buoyancy, hydrostatic stability and their shell orientation), ultimately defining the locomotion and the type of habit (benthic, pelagic, nektonic, planktonic, etc.) of the living organism. Due to the lack of proper extant ammonoid analogs to evaluate the functional morphology of the conch (Jacobs and Landman 1993), researchers have the challenge of finding innovative ways to accurately constrain its hydrostatic properties.
Several approaches have been employed to study the ammonoid conch. The morphometrical approach is by far the most commonly applied (e.g., Korn 2010; Ritterbush and Bottjer 2012; Klug et al. 2015; Tendler et al. 2015; Hoffmann et al. 2019; Korn et al. 2019). This method quantifies discrete parameters of the conch morphology, allowing the assessment of their inter- and intraspecific variability (Raup 1967; De Baets et al. 2013). In a previous work, Morón-Alfonso (2019) pointed out that this methodology combined with computed tomography scan data, can be used to craft accurate 3D models of ammonoid conchs using modern computer-based modeling methods. Herein, we describe a 3D modeling process to study the ammonoid conch that can be used to evaluate its hydrostatics properties. In a case of study, we apply this methodology to the previously studied kossmaticeratid Maorites seymourianus using data extracted from ten specimens of the López de Bertodano Formation (Upper Cretaceous, James Ross Basin, Antarctica; Morón-Alfonso 2019).
Shell orientation attained during neutral buoyancy is an interesting subject of study because it is directly linked to the locomotion of the living organism. As in any submerged body, the shell orientation in ammonoids depended on the position of two important virtual points within the conch—the center of mass and the center of buoyancy (Raup and Chamberlain 1967). The vertical alignment between these centers defines the static shell orientation, usually measured as the angle between the aperture and the vertical line formed by these points. According to Naglik et al. (2015), three types of models have been employed to estimate the shell orientation in ammonoids, mathematical models, mechanical models, and empirical models. Mathematical models are based on classical morphometrical parameters such as the Raupian parameters (i.e., the expansion rate, the area of last generating curve, and the distance from the coiling axis; Raup 1967). Commonly, these models include the assumption of self-similar, logarithmic shell growth, uniform shell thickness independent of the position in the whorl section, and the presence of a stable coiling axis. None of these simplified assumptions necessarily coincide with actual ammonoid shells (Naglik et al. 2015). Mechanical models are physical models made of different materials (e.g., plastic), used to estimate the hydrostatic properties experimentally (e.g., Trueman 1940; Jacobs 1992; Okamoto 1996; Klug and Korn 2004; Higashiura and Okamoto 2012; Westermann 2013; Parent et al. 2014). Finally, empirical models are three-dimensional physical models of ammonoid shells constructed from stacks of physical or virtual cross-sections cut through a real shell. Based on these data, researchers can reconstruct the shell in detail using virtual techniques for later studies (e.g., Tajika et al. 2015; Lemanis et al. 2015).
Recently, a new type of models, used to study the hydrostatic properties of cephalopods, was described by Peterman et al. (2019b) known as the virtual models. These models are virtual representations of the conch made with 3D modeling programs. Peterman et al. (2019a) noted some advantages of these models: (i) they are not constrained by the sample preservation;(ii) they can be modified depending on the necessities of the study (e.g., different ontogenetic stages); (iii) they allow for precise calculations. In this work, we document in detail a methodology to construct a basic virtual model of an ammonoid conch. Constraints of the method and new parameters are also documented.
Institutional abbreviations—CPBA, Colección de Paleontología de la Universidad de Buenos Aires, Buenos Aires, Argentina.
Other abbreviations.—ahao, aperture height; dm, diameter; sgt, segment thickness; SHER, segment height expansion rate; STER, segment thickness expansion rate; St, stability index; Sto, Okamoto’s stability index; SWER, segment width expansion rate; whao, whorl height; wwao, whorl width.
Material and methods
Ten relatively large specimens of Maorites seymourianus ranging 150–300 mm in diameter (Fig. 1) were used to calculate the parameters required for the modeling process. This species is characteristic from the Upper Cretaceous deposits from the Seymour Island in Antarctica (for more information of this species see Morón-Alfonso 2019). M. seymourianus displays two ontogenetic stages. The first stage, named as Perlatum Stage, is transitional and is documented from 10–26 mm in diameter. In this stage, the conch undergoes a rapid morphological change exhibiting an increase in involution and a decrease in whorl width. At larger diameters the conch morphology stabilizes reaching the so called Gibbosum Stage. This second stage shows a constant conch morphology, extremely discoidal, weakly compressed, and subevolute (Fig. 1), coinciding with the description of this species by Macellari (1986). Ornamentation is common in both stages, and consists of sinuous prosiradiate ribs crossing the venter without interruption, and bifurcating at the middle of the flank. There are also relatively large umbilical nodes that extend radially, and deep prosiradiate constrictions ranging from four to five per whorl. Stronger ornamentation can be observed at the body chamber of adults of this group (Fig. 1). The body chamber angular length of the adult specimens varies between 150–170°.
Samples are housed at the collection of the Facultad de Ciencias Exactas y Naturales, Universidad de Buenos Aires, Buenos Aires, Argentina, under the acronym CPBA. The specimens of M. seymourianus from the Campanian–Maastrichtian of the Lopez de Bertodano Formation are catalogued with the following numbers: CPBA 16805, CPBA 16814, CPBA 16830, CPBA 16836, CPBA 16838, CPBA 16842, CPBA 16846, CPBA 16847, CPBA 16851, and CPBA 16891. To obtain accurate virtual models, the chosen specimens were adults, excellently preserved as non-deformed 3D objects including eight specimens displaying a complete body chamber.
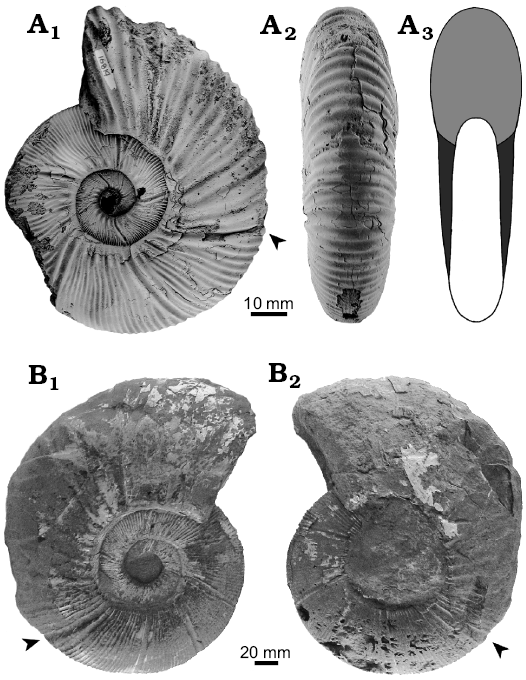
Fig. 1. Kossmaticeratid ammonoid Maorites seymourianus (Kilian and Reboul, 1909) from the López de Bertodano Formation, Upper Cretaceous of Antarctica. A. CPBA 16819 (microconch), lateral (A1), ventral (A2) views, scheme of apertural view (A3). B. CPBA 16841 (macroconch) showing different preservation states between the flanks, left (B1), right (B2) views. The arrowheads indicate the beginning of the body chamber.
Modeling the ammonoid conch
The modeling process is based on the methodology described by Peterman et al. (2019a, b, 2020). This method consists of the construction of a virtual model of the conch through the iteration of a segment (i.e., whorl section) implementing the array tool from the open-source program Blender 2.81 (Blender Online Community 2019). This array generation tool can be further used to iterate an object and then transform it, similarly to the morphospace instructions of Raup (1967). According to Peterman et al. (2019a, b, 2020), this can be used to construct any ectocochleate cephalopod shell, especially when arrays are used in a piecewise fashion to accommodate ontogenetic changes. Later, the segments are merged and the model is exported as a 3D file format (usually a tessellated triangular mesh abbreviated as .stl file). The exported virtual model contains some inconsistencies such as open meshes, duplicated vertices, and overlapping or inverted faces which need to be fixed with another program e.g., Meshmixer 3.5 (Autodesk Inc. 2020a); Netfabb 2018.3 (Autodesk Inc. 2020b) or Meshlab (Cignoni et al. 2008). This produced manifold 3D meshes, which are required to compute the centers of mass, volumes, and other geometrical measurements. The modeling process described can be modified depending on the objectives of the study, and can be used to model other shell elements such as the septa and the siphuncle (e.g., Peterman et al. 2019a, b, 2020). Herein, the 3D modeling process was modified, and the procedure is resumed in following steps:
Determination of the conch geometry.—To determine the spiral equation for the studied species, which is fundamental for further calculations, the conch radius variation through ontogeny is measured from virtual longitudinal cross-sections of each specimen in 30° (π/6 rad) steps up to a minimum diameter of 10 mm. These data were obtained from the previous CT-scan data used by Morón-Alfonso (2019). Then, shell geometry for each specimen can be defined as a function in polar coordinates following the expression:
r = f(θ) (1)
where θ is the angle (in degrees or radians, here we use the former due to smaller numbers) and r is the shell radius (Fig. 2). Later, the angle against the radius can be graphed in a basic x, y coordinate system. The expression that resumes the relation of these parameters can be estimated using polynomial fit or another regression method. For statistical analyses we used the software Past 4.02 (Hammer et al. 2001).
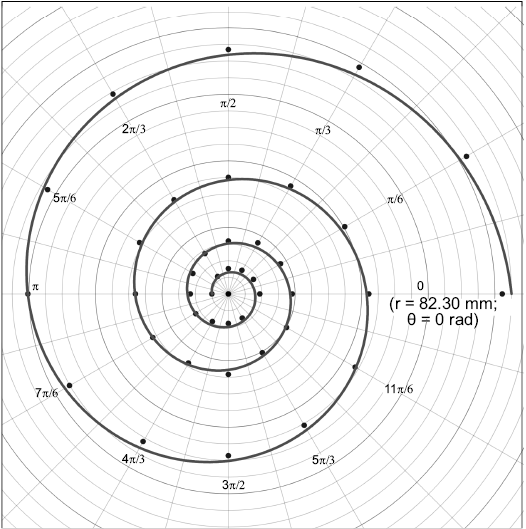
Fig. 2. Semi-landmarks in π/6 rad steps (30°) and the model curve of the geometry for Maorites seymourianus (CPBA 16847). The first landmark is expressed in polar coordinates (r; θ). Abbreviations: θ, angle; r, radius.
Given that the starting point of measure is different for each specimen, a problem first noted by Hoffmann et al. (2019), it is required further alignment (normalization) of the data to calculate the generalized expression (for the species) needed for the modeling process. To solve this issue, the result in degrees from the function (1) was calculated for a specific radius (r = 20 mm at dm = ~34 mm in the Gibbosum Stage) for each curve (from each specimen; Fig. 3A). Consequently, the starting point of the first sample measured (CPBA 16847) was used as a reference, and the domain of the rest of the samples was modified accordingly (adding or subtracting the difference in angle) to align all the curves (Fig. 3B).
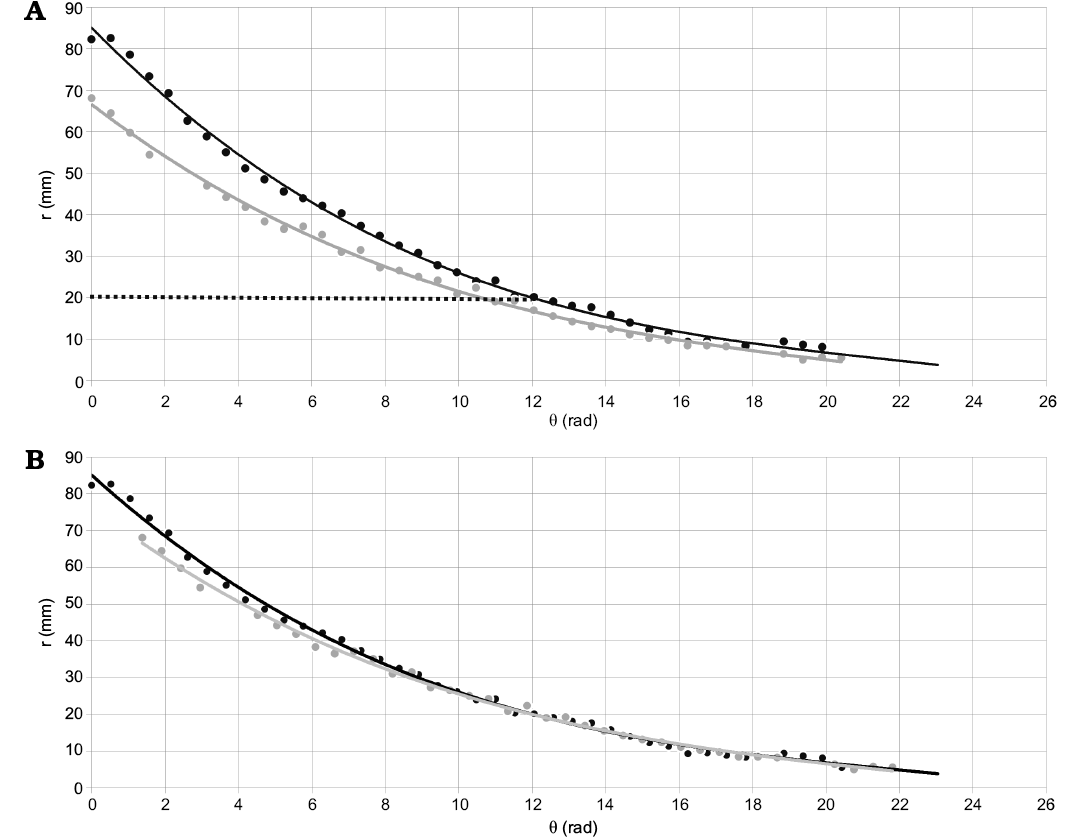
Fig. 3. Example of the alignment process using only two specimens. Here it is graphed the radius against the angle showing the curves that describe the geometry of two specimens of Maorites seymourianus. A. The geometry of CPBA 16847 (reference) is defined by a function r = h(θ) and its domain is [0 rad; 19.90 rad] in black (solid line), the geometry of CPBA 16838 is defined by a function r = i(θ) and its domain is [0 rad; 20.42 rad] in grey. The normalization process consists of finding the results for an appropriate radius, in this case r = 20 mm (dotted line). Following, the difference in angle must be calculated (Δθ = 1.38 rad) and then the domain of the functions is adjusted accordingly. B. Curves after normalization, the difference in angle was applied to the domain of CPBA 16838, the new domain of the function is [1.38 rad; 21.80 rad]. Abbreviations: θ, angle; r, radius.
Calculation of segment parameters.—The segment required for iteration is a whorl section of a M. seymourianus conch (Fig. 4). To simplify the modeling process, the selected whorl section is located at the Gibbosum Stage (at dm 90 mm), so a constant shell growth and a stable conch morphology can be considered.
The basic contour of the segment was based on an illustration taken from a transversal cross-section of the specimen CPBA 16847 from the CT-scan data (Fig. 4). The following parameters were measured on the adoral side of the segment (based on Korn 2010): aperture height (ahao), whorl height (whao), and whorl width (wwao, Fig. 4A). Segment thickness (sgt), defined as the arc length of the spiral (L) on the ventral side of the segment, must be supplied by the user and optimized for the specific research question (Fig. 4B). As noted by Peterman et al. (2019a), file size is a limitation of this method, so in this case, a custom segment thickness of 10 mm was considered.
After the segment thickness is defined, the size in degrees between the adoral side and the adapical side must be determined. To do so, we used a generalized equation to determine the arc length of the curve in polar coordinates, following the expression:

where L is the arc length of the curve defined by a function f(x), a is the angle coordinate in the adoral side, b is the angle coordinate in the adapical side, r is the radius in milimeters, and θ is the angle in radians. Next, using the functions summarized in Table 1, the whorl parameters (ahad, whad, wwad) were calculated for the adapical side of the segment (Fig. 4C).
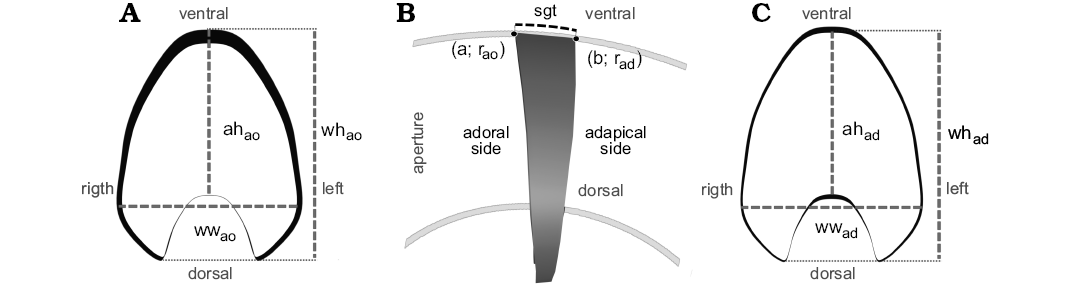
Fig. 4. Overview of the segment employed in this modeling method. A. Adoral view of the segment, the contour and measurements for this side were obtained from the CT-scan data. B. Lateral view of the segment showing the segment thickness (sgt = 10 mm). C. Adapical view of the segment. To model this side, the adoral contour was duplicated and then escalated according to the results from the equations in Table 1. Abbreviations: a, result for the angle in the adoral side for Equation (2); ah, aperture height; ad, adpical; ao, adoral; b, result for the angle in the adapical side for Equation (2); r, radius; sgt, segment thickness; wh, whorl height; ww, whorl width.
Table 1. Statistic summary from the function models of the morphological parameters in Maorites seymourianus. The function of the polynomial regression f(x), R2 is the determination coefficient, or proportion of variance explained by the model, a p-value, based on an F test, gives the significance of the fit (modified from Morón-Alfonso 2019). Abbreviations: ah, aperture height; dm, diameter; r, radius; wh, whorl height; wu, umbilical width; ww, whorl width.
|
Parameter |
Model |
Order |
f(x) |
R2 |
F |
p |
|
ah |
polynomial |
2 |
1,888 × 10-5 dm2 + 0.267 dm + 2,01 |
0.980 |
5675.7 |
<0.05 |
|
wh |
polynomial |
2 |
1.388 × 10⁻⁵ dm2 + 0.355 dm + 1.749 |
0.986 |
7507.7 |
<0.05 |
|
ww |
polynomial |
2 |
9.707 × 10⁻⁵ dm2 + 0.255 dm + 2.497 |
0.963 |
2573.8 |
<0.05 |
|
uw |
polynomial |
3 |
-7.510 ×10⁻⁶ dm3 + 2.740 × 10⁻⁴ dm2 + 0.079 dm + 6.255 |
0.970 |
1731.2 |
<0.05 |
|
r |
polynomial |
1 |
0.582 dm + 0.6488 |
0.998 |
17824 |
<0.05 |
Inner thickness and ornamentation.—To provide inner thickness to the segment to emulate the shell wall, a solidify modifier (Blender 2.81) is used in the first segment (after applying the required transformations). This tool takes the surface of any mesh and adds depth to it. Intersected faces in acute angles of the segment can be generated from this process, so further editing of the basic mesh will be required. It is advisable to separate the external and internal layers of the segment which simplify the further steps in the modeling process (Fig. 5). Later, the model must be closed in the final step of the modeling process.
Afterwards, basic ornamentation can be generated in the surface of the segment through corrugation of the shell wall, in this case we model simple rectiradiate ribs from loop cuts (a Blender 2.81 command that generates edge loops subdividing the faces of a mesh; Fig. 5). Sinuous ribs that bifurcate are particularly difficult to model. Such features can be completed in a segment with a high resolution using sculpting tools, but previous testing was unsuccessful due to the alteration of the segment parameters. Approximately two ribs per segment were counted on the selected region from the studied specimens (Fig. 5).
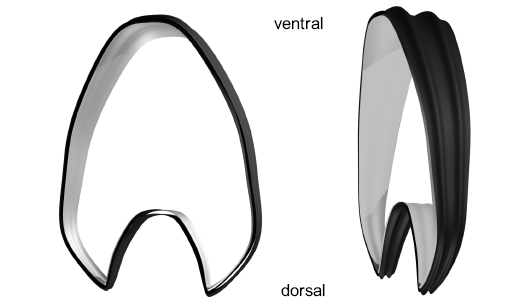
Fig. 5. Final segment in two views showing the rectiradiate ribs and the two surfaces emulating the limits of the shell wall. The external layer in black and the internal layer in grey.
Construction of the virtual 3D model.—Once the segment parameters are defined, we can proceed to construct the virtual model. First, array parameters must be specified. For this purpose, an additional object (i.e., object offset) is required to set the transformations that will be applied on each iteration of the segment (e.g., if the object offset is rotated, duplicates of the segment will be rotated following the same transformation; Fig. 6). In the array tool of Blender 2.81, this is achieved by choosing the object offset option and defining an object (usually an empty object such as a plain axis). The transformations of this object are defined by the new morphometric parameters explained below.
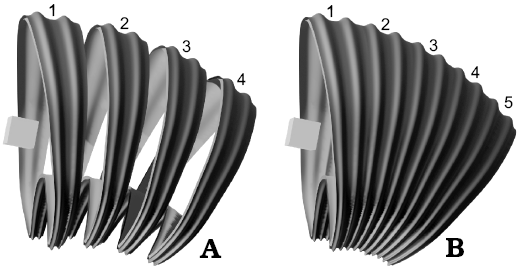
Fig. 6. Illustrations showing the function of the relative offset and object offset. In this case, the object offset is a cube rotated in the y-axis. Segments are labeled in order of appearance. Note how each segment follows the transformation of the object offset. A. The relative offset has been modified to show each segment as a separate object. B. The relative offset with the correct value forming a unified structure.
The first transformation required is the rotation of the object offset in order to obtain the spiral geometry of the conch. The angle of this rotation is the difference in angle between the adapical and adoral side of the segment (Table 2).
Further, to emulate the natural shell growth, the object offset should be scaled in the x, y, and z axis. This scaling depends on the following parameters: the segment thickness expansion rate (STER), defined as the increase in thickness of the segment between the first and the second segments. The segment width expansion rate (SWER), defined as the increase in whorl width between the adapical and the adoral side of the segment. And finally, the segment height expansion rate (SHER), defined as the increase in whorl height between the adapical and the adoral side of the segment (Table 2). These parameters are defined for a unique value of Δθ = 0.1817 rad based on the segment thickness, but can be modified in the form of an index that can be applied to different values of Δθ (Table 3).
Table 2. Summary of array parameters required for the modeling process of Maorites seymourianus. STER, segment thickness expansion rate; sgtn, segment thickness for an n segment. SWER, segment width expansion rate; wwad, whorl width of the adapical side; wwao, whorl width of the adoral side. SHER, segment height expansion rate; whad, whorl height of the adapical side; whao, whorl height of the adoral side. Rotation is defined by the difference in angle |Δθ|; a, is the angle in the adoral side obtained from Equation (2); b, the angle in the adoral side obtained from Equation (2).
|
Object offset transformation |
Value |
Source |
|
Scale x |
0.9767 |
sgt2/sgt1 = STER |
|
Scale y |
0.9788 |
wwa/wwo = SWER |
|
Scale z |
0.9777 |
wha/who = SHER |
|
rotation y (in radians) |
0.1817 |
Δθ = |a–b| |
Table 3. Indices based on the array parameters to be used in an unspecified Δθ. STER, segment thickness expansion rate; SWER, segment width expansion rate; SHER, segment height expansion rate. STI, segment thickness index; SWI, segment width index; SHI, segment height index.
|
Index expression |
Value in radians |
Value in degrees |
|
STER/Δθ = STI |
5.3753 rad-1 |
0.0938 deg-1 |
|
SWER/Δθ = SWI |
5.3869 rad-1 |
0.0940 deg-1 |
|
SHER/Δθ = SHI |
5.3808 rad-1 |
0.0939 deg-1 |
Ultimately, the segment can be iterated by integers; the final number resulting from this operation is constrained by the capabilities of the hardware available. In this work, 150 segments were necessary to construct the virtual model. The space between segments (relative offset) can be variable depending on the modeling process, as it is determined by the bounding box (i.e., the smallest rectangular box that contains a 3D object) and the position of the segment with respect to the origin. Herein, the body chamber and the phragmocone were constructed as separate structures. This simplifies the calculations of the center of mass and the center of buoyancy, the final diameter of the 3D models was 106 mm considering a body chamber of 160° in length (Fig. 7A).
Additional elements.—Additional elements such as the septa, the siphuncle, and the initial chamber, can be added to increase the accuracy of the model. Septa were modeled from the surface of the adapical side of the segment. This surface was edited to emulate the natural curvature found in the septa of ammonoids. Then, an array modifier was applied following the object offset parameters established previously. A septal spacing ranging 18–22° was measured from M. seymourianus specimens showing a higher variation in the Perlatum Stage. Nonetheless, such variation is very difficult to model; complex transformations and modification of the array parameters should be expected using different ranges of septal spacing. For this reason, we use the mean value for septal spacing of 20° (Fig. 7B). The increase of folding through ontogeny of the septa cannot be modeled using this method. An alternative technique using photogrammetry to model septal folding can be seen in Peterman (2019a, 2020). The siphuncle was constructed following Peterman et al. (2019b; Fig. 7B), and the initial chamber was modeled based on a spherical object modified to be used as the end cap in the array modifier of the segment (closing the shell apex; a blender native file of the model can be downloaded from SOM 4_5).
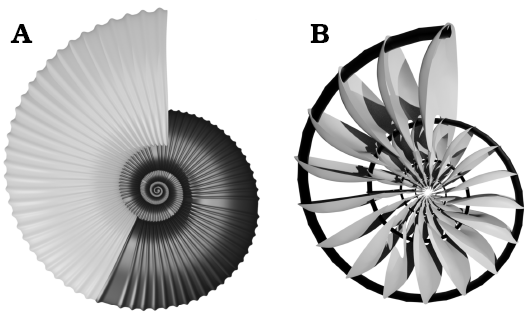
Fig. 7. The final simplified model of the conch of Maorites seymourianus. A. External elements of the conch in lateral view, the smooth areas emulate rectiradiate constrictions; the phragmocone in dark gray, the body chamber in grey. B. Internal elements within the phragmocone; the siphuncle in black, the septa in grey.
Hydrostatic properties
Buoyancy.—According to the principle of Archimedes, buoyancy is the difference between the total weight of the animal and the buoyant force (Lemanis et al. 2015); the buoyant force is equal to the weight of the displaced fluid such that the volume of fluid is equal to the total volume of the object that displaces that fluid. This relationship is expressed as:
Buoyancy (N) = Mwg – Mtg (3)
where, Mw is the mass of the displaced fluid (seawater); Mt is the total mass of the object in kg, and g is the gravitational acceleration (9.8 m/s2 approximately). Data required to estimate the buoyancy of ammonoids are summarized in SOM 1 (Supplementary Online Material available at http://app.pan.pl/SOM/app65-Moron-Alfonso_etal_SOM.pdf). Shell wall thickness was measured from cross-sections of the conch from the CT-scan data, and volumes were measured directly from the virtual models using Autodesk Inventor Professional 2019 (Autodesk Inc. 2019). The volume of the displaced water was determined from a closed external surface with a sealed aperture based on the original virtual model of M. seymourianus.
Center of mass and center of buoyancy.—The center of total mass/gravity is estimated using the coordinates of the center of mass of each individual element that constitute the virtual model and applying the expression:

where G is the x, y, or z coordinate of the center of total mass, K is the x, y, or z coordinate of the center of mass of a single object measured concerning an arbitrary datum, and M0 is the mass of each of the elements that compose the virtual model (Peterman et al. 2019b). The center of buoyancy is the center of mass of the displaced water. Locations of all the centers of masses were obtained using Inventor Professional 2019 (Autodesk Inc. 2019).
Once the positions of the center of mass and buoyancy are determined, the stability index (St) can be calculated. The St was defined first by Raup (1967) and Raup and Chamberlain (1967) “as the ratio between the distance between the center of buoyancy and the center of mass of the soft body to the shell diameter”. Later, Okamoto (1996) redefined the stability index (Sto) “as the ratio of the distance between the centers of buoyancy and mass to the cube root of the shell’s total volume”, so it can be applied to non-planispiral cephalopods. Both indices were determined, so results can be compared with all the available data. Finally, the shell orientation achieved under the condition of neutral buoyancy was calculated. As stated previously, shell orientation is defined as the angle between the aperture and the vertical line formed by the alignment of the center of mass and buoyancy (Naglik et al. 2015; Lemanis et al. 2015).
Herein, we tested two models of M. seymourianus in two states (with a filled or empty last chamber). The first model consists of that having the maximum shell weight possible including the highest thickness and shell density documented (1.79 mm and 2.70 g/cm3, respectively). The second model has the minimum shell weight possible with the minimal shell thickness and shell density available (1.50 mm and 2.50 g/cm3, respectively). The studies also include the effect of the size of the mantle cavity, varying from 10%, 15%, and 20% of the body chamber, covering a 5% difference from the values registered for Nautilus (Lemanis et al. 2015). Furthermore, we compared a simple septum of Orthoceras regulare and a folded septum of Baculites compressus (Peterman et al. 2019a, b) for a whorl cross-section with the same transversal area and a uniform thickness of the septa. Because these septa have the same thickness and cover the same area, the net increase in volume can only be attributed to the increase in the surface from the septum folding. The septum of M. seymourianus would be most similar in complexity to the Baculites septum than that from Orthoceras. From this comparison, we estimated a deficit in the septum volume of around 20% caused by the lack of folding. Thus, to emulate the septum folding, we also tested a model with an additional 20% in volume for all the ammonoid septa. This approximation does not account for the generally thicker nautiloid septa, and the variation in septal thickness observed in ammonoid septa (Klug and Hoffmann 2015). Anyhow, there are no other comparisons available to test this factor. An alternative method, consists of comparing the simple model of the septum used herein to an empirical model of a M. seymourianus septum based on Micro CT-scanning data (not available yet), adding the difference in volume/mass to the virtual model, and solving the issues caused by the increase in complexity of the mesh.
Results
Spiral equation.—From the evaluation of the geometry based on semi-landmarks from the longitudinal cross-section of each specimen extracted from the CT-scan data, we observe a low variation regarding the conch geometry of Maorites seymourianus, showing little differences through ontogeny in each specimen (Fig. 8). Local outliers could indicate pathologies, shell damage, or be related to the constrictions. The model function that fits best with the data obtained from the measurements is a third-order polynomial function (R = 0.995, p < 0.05) following the expression:

where r is the radius and θ is the angle in radians (Fig. 8).
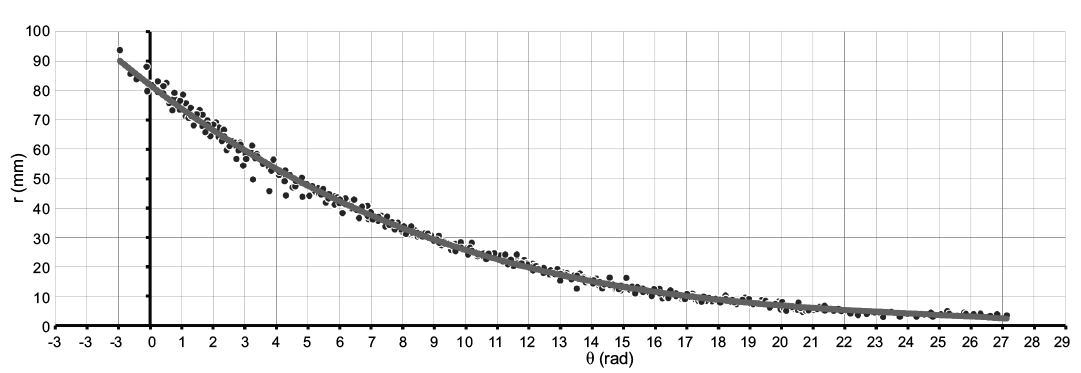
Fig. 8. Linear plot of the rotational angle against the radius showing the model curve of Maorites seymourianus, in black the semi-landmarks that describe the conch geometry for each specimen (n = 407, see SOM 2). Abbreviations: θ, angle; r, radius.
This expression looks similar to an exponential equation, but reaches higher values of whorl expansion at the beginning and lower values at the end of the curve, unlike to what is observed in a regular exponential function (Fig. 9). Note that predictions of this model curve are only accurate for the values determined by the interval within the domain, this is a usual constraint from regression methods (Hammer et al. 2001).
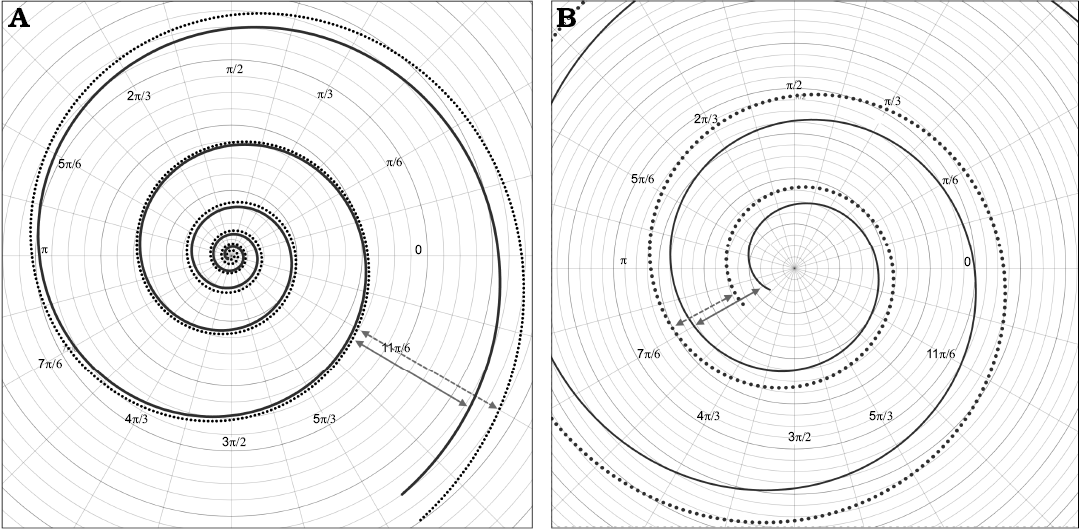
Fig. 9. A. Comparison of the model geometry for Maorites seymourianus defined by the Equation 3, and the closest logarithmic spiral (dotted line) found for these data (radius r = 88.97e-0.12θ, determination coefficient R2 = 0.988). B. Close up of the initial whorls showing the slow increase in growth rate at the beginning of the ontogeny. The arrows indicate the differences in growth between the polynomial curve (solid arrows) and the logarithmic curve (dashed arrows).
Hydrostatic properties.—A range of parameters were tested for this work including intermediate values including the shell density, shell wall thickness, mantle cavity size, the state of the phragmocone, and the addition of 20% of the septum volume (to emulate septal folding). Here we report the extreme cases (e.g., heaviest and lightest shell density, thickest-thinnest shell walls, largest-smallest mantle cavity) in order to establish the wider estimation ranges, the complete list of the results can be found in SOM 3.
The buoyancy results of the models of Maorites seymourianus are summarized in Table 4. According to these results, the model with an empty phragmocone shows a slightly positive to negative buoyancy ranging from -0.0471 N to 0.1547 N, and -0.0746 N to 0.1293 N, when the septal volume is increased in 20%. The model with the last chamber filled reaches lower buoyancy values ranging from -0.0581 N to 0.1437 N, and -0.0856 N to 0.1183 N, caused by the effective increase in mass. These results in the form of relative density are summarize in SOM 3. Stability results are summarized in Table 5. Both models show low stability values, ranging from St = 0.0579–0.0742, and Sto = 0.0163–0.0205, for the model with an empty phragmocone and St = 0.0729–0.0557, and Sto = 0.0157–0.0206, respectively, for the model with the last chamber filled. Finally, results of the aperture orientation are summarized in Table 6 and coordinates from each relevant element are resumed in SOM 3. Apertural orientations of 75–76°with respect to the vertical were estimated in the model with an empty phragmocone and approximately 74–75° in the model with the last chamber filled (Fig. 10).
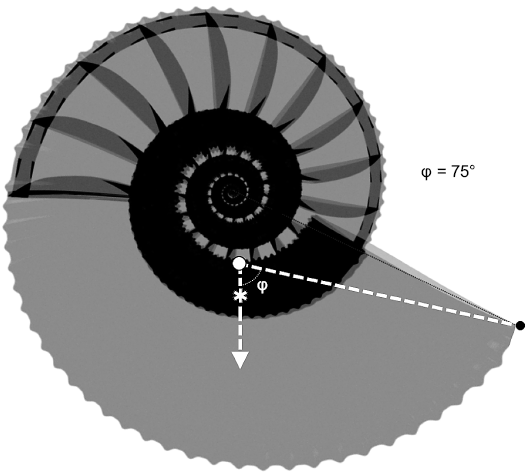
Fig. 10. Model showing the shell orientation (φ) attained during neutral buoyancy for Maorites seymourianus models. White circle, center of buoyancy; asterisk, center of mass.
Table 4. Buoyancy results for the models of Maorites seymourianus with a filled and empty last chamber for the studied densities (ρ), shell thickness (T), varying the percentage of mantle space of the body chamber (B.C.) and the 20% increase in septa volume (S.V.) to emulate the lack of septal folding.
| |
Empty phragmocone |
Last chamber filled |
||
|
Mantle cavity |
10% B.C. |
10% B.C.+ 20% S.V. |
10% B.C. |
10% B.C.+ 20% S.V. |
|
(T = 1.5 mm, ρ = 2.5 cm3/gr) |
0.0924 N |
0.0669 N |
0.0814 N |
0.0559 N |
|
(T = 1.79 mm, ρ = 2.7 cm3/gr) |
-0.0471 N |
-0.0746 N |
-0.0581 N |
-0.0856 N |
|
Mantle cavity |
15% B.C. |
15% B.C.+ 20% S.V. |
15% B.C. |
15% B.C.+ 20% S.V. |
|
(T = 1.5 mm, ρ = 2.5 cm3/gr) |
0.1235 N |
0.0981 N |
0.1126 N |
0.0871 N |
|
(T = 1.79 mm, ρ = 2.7 cm3/gr) |
-0.0175 N |
-0.0451 N |
-0.0285 N |
-0.0560 N |
|
Mantle cavity |
20% B.C. |
20% B.C.+ 20% S.V. |
20% B.C. |
20% B.C.+ 20% S.V. |
|
(T = 1.5 mm, ρ = 2.5 cm3/gr) |
0.1547 N |
0.1293 N |
0.1437 N |
0.1183 N |
|
(T = 1.79 mm, ρ = 2.7 cm3/gr) |
0.0119 N |
-0.0155 N |
0.0010N |
-0.0265 N |
Discussion
Virtual modeling
Despite not being as accurate as empirical models, virtual models are a good alternative to study the ecology of extinct cephalopods, allowing us to overcome some of the usual assumptions of mathematical models such as that of an elliptical aperture, or a constant coiling axis (e.g., Raup 1967; Erlich et al. 2016). Furthermore, through 3D printing they can be tested as physical models (e.g., Peterman et al. 2019a) or be modified for computer fluid analyses (e.g., Hebdon et al. 2020). This flexibility has even allowed the modeling of complex heteromorph shells (e.g., Peterman et al. 2020). Herein we described a virtual modeling process to emulate standard conch morphologies to be applied to more common ammonoid associations, bringing novel autoecological data and complementing more extensive works. Additionally, through the variation of the physical factors that controlled the hydrostatic properties, we could also isolate the effect on buoyancy, stability and shell orientation of several conch parameters. In this regard, some results found herein, reflect that there are still several issues to uncover related to ammonoid ecology.
As in any methodology, there are some constraints that should be considered. A limitation of this method is the difficulty to model changes through ontogeny. This is especially important in groups with a high intraspecific variation such as ammonoids (Klug et al. 2015). Septal folding is probably the best example, because the inability to model the increase in septal complexity further implies that the calculated hydrostatic values are not sufficiently accurate. Another limitation is related to the ornamentation. In general, bifurcations, sinuosity and truncations on radial elements, and all spiral elements, are particularly challenging to model, usually requiring an increase in the resolution of the segment (more complex/dense mesh), thus boosting the hardware requirements. Finally, replicability seems to be another subject of consideration, as minor details during the segment modeling process can alter its position with respect to the origin, requiring the need of adjustments in the modeling (array) parameters. This does not entail that results obtained from the replicated model will be erroneous, but that the modeling process become time consuming, and that the modeling parameters will differ from the original virtual model from which it is based on. Looking at this situation from another point of view, obtaining consistent results between different modeling methods implies that we are objectively approaching reality, so researchers should encourage developing and testing new methodologies. There is also room for improvement; the functions obtained in this work and by Morón-Alfonso (2019) may be used in the function surface generator included in Blender 2.81 allowing modeling the morphological changes through the ontogeny of M. seymourianus. Multiple arrays can also be used in piecewise manner depending on computing capability to approximate ontogenetic changes (Peterman et al. 2020).
Spiral geometry and growth rate
As noted by Raup (1967) the spiral geometry of ammonoids is close to a logarithmic spiral following an almost exponential function. However, our results indicate that Maorites seymourianus conch geometry can be defined by a third order polynomial function, showing higher values of whorl expansion at the beginning of the curve and lower in the last whorl than the ones expected from a logarithmic function (i.e., with a constant growth rate; Figs. 8, 9). This tendencies can be related to variations in the soft body growth, and coincide approximately to the generalized growth curve proposed for ammonoids by Bucher et al. (1996), showing acceleration in growth at early stages of ontogeny, followed by a constant growth during the juvenile stage, and a deceleration approaching adulthood. The aforementioned phenomenon could also be related to the terminal countdown of heteromorphs described by Seilacher and Gunji (1993) and observed in Nautilus (Tajika and Klug 2020). It must also be considered that through the linear relationship between the diameter and the radius (Table 1), there is an association between the polynomial function and other parameters more traditionally used to test changes in growth rate such as the whorl expansion rate (Klug et al. 2015) and the actual expansion rate (Ritterbush and Bottjer 2012). Anyhow, in M. seymourianus clear ontogenetic stages cannot be defined using this function and morphological changes through ontogeny seem more evident in other parameters such as the whorl width index and the umbilical width index (see Morón-Alfonso 2019). The low variation in geometry of M. seymourianus specimens also could indicate that the shell generation processes (at least in this species) were very conservative and strongly regulated, only disturbed by pathologies, growth halts, and maybe perturbed environments (Tajika et al. 2020).
Hydrostatic properties and ecology
Buoyancy.—The 3D models of Maorites seymourianus show a slightly positive to negative buoyancy, allowing the determination of a possible range of values for this parameter, reaching a minimum of B = -0.0856 N and a maximum of B = 0.1547 N for the highest and lowest mass tested from the models respectively. Due to the implicit increment in mass, lower buoyancy estimations are expected from the increase in shell density, shell thickness, and/or the presence of intracameral liquid (Table 4). It must be also considered that some structures and tissues were not acknowledged for the hydrostatic calculations; these elements include, for example, the buccal mass and other soft tissues within the phragmocone (Polizzotto et al. 2015), so we can infer lower buoyancy values than the ones obtained here, as the addition of any other structure (e.g., calcified lower jaws) also increases the total mass of the organism.
It is likely that M. seymourianus could have achieved neutral buoyancy or tended to be slightly negative. In this regard, the thickness and density of the shell wall played a major role, but in mollusks these parameters show intrinsic variability, usually varying in organic content due to environmental constraints, pathologies, or depending of the ontogenetic stage (Urdy et al. 2010; Marin et al. 2012) so it is difficult to assess a precise buoyancy value, and most likely it changed through the ontogeny. The role of the ornamentation in buoyancy is another interesting discussion subject. When the model of M. seymourianus is compared with a simplified version without ribs, a volume difference of around 16% is observed on the shell wall, which implies a significant increase in mass. This suggests a functional role for the ornamentation and could be important to explain the Buckman’s rules of covariation, commonly more associated with morphogenetic processes (see Monnet et al. 2015).
Stability.—Considering the stability index defined by Raup (1967) and Raup and Chamberlain (1967), the M. seymourianus models exhibit relatively low stability values ranging from St = 0.056–0.073 (Table 5A) when compared to Nautilus pompilius that has been estimated around St = 0.090 (Parent et al. 2012). This difference is emphasized when it is compared with the stability index of Okamoto (1996), which ranges from Sto = 0.016–0.021 in the M. seymourianus models (Table 5B) and of Sto = 0.050–0.064 in N. pompilius (Peterman et al. 2019b). The low stability values obtained from the M. seymourianus models also agree with the results obtained for Cadoceras sp. (Lemanis et al. 2015) and corroborates the claim that most planispiral ammonoids possessed a low hydrostatic stability (Naglik et al. 2015).
Table 5. Stability results for the models of Maorites seymourianus with and without an empty last chamber for the studied densities (ρ), shell thickness (T), varying the percentage of mantle space of the body chamber (B.C.) and the 20% increase in septa volume (S.V.) to emulate the lack of septal folding.
|
A. Stability Results (St) |
Empty phragmocone |
Last chamber filled |
||
|
Mantle cavity |
10% B.C. |
10% B.C.+ 20% S.V. |
10% B.C. |
10% B.C.+ 20% S.V. |
|
(T = 1.5 mm, ρ = 2.5 cm3/gr) |
0.0742 |
0.0683 |
0.0718 |
0.0659 |
|
(T = 1.79 mm, ρ = 2.7 cm3/gr) |
0.0664 |
0.0609 |
0.0643 |
0.0588 |
|
Mantle cavity |
15% B.C. |
15% B.C.+ 20% S.V. |
15% B.C. |
15% B.C.+ 20% S.V. |
|
(T = 1.5 mm, ρ = 2.5 cm3/gr) |
0.0728 |
0.0667 |
0.0729 |
0.0669 |
|
(T = 1.79 mm, ρ = 2.7 cm3/gr) |
0.0650 |
0.0594 |
0.0629 |
0.0573 |
|
Mantle cavity |
20% B.C. |
20% B.C.+ 20% S.V. |
20% B.C. |
20% B.C.+ 20% S.V. |
|
(T = 1.5 mm, ρ = 2.5 cm3/gr) |
0.0713 |
0.0651 |
0.0687 |
0.0627 |
|
(T = 1.79 mm, ρ = 2.7 cm3/gr) |
0.0636 |
0.0579 |
0.0614 |
0.0557 |
| |
||||
|
B. Okamoto’s Stability Results (Sto) |
Empty phragmocone |
Last chamber filled |
||
|
Mantle cavity |
10% B.C. |
10% B.C.+ 20% S.V. |
10% B.C. |
10% B.C.+ 20% S.V. |
|
(T = 1.5 mm, ρ = 2.5 cm3/gr) |
0.0209 |
0.0193 |
0.0202 |
0.0186 |
|
(T = 1.79 mm, ρ = 2.7 cm3/gr) |
0.0187 |
0.0172 |
0.0181 |
0.0166 |
|
Mantle cavity |
15% B.C. |
15% B.C.+ 20% S.V. |
15% B.C. |
15% B.C.+ 20% S.V. |
|
(T = 1.5 mm, ρ = 2.5 cm3/gr) |
0.0205 |
0.0188 |
0.0206 |
0.0189 |
|
(T = 1.79 mm, ρ = 2.7 cm3/gr) |
0.0184 |
0.0168 |
0.0177 |
0.0162 |
|
Mantle cavity |
20% B.C. |
20% B.C.+ 20% S.V. |
20% B.C. |
20% B.C.+ 20% S.V. |
|
(T = 1.5 mm, ρ = 2.5 cm3/gr) |
0.0201 |
0.0184 |
0.0194 |
0.0177 |
|
(T = 1.79 mm, ρ = 2.7 cm3/gr) |
0.0179 |
0.0163 |
0.0173 |
0.0157 |
In most cases, the increase of the studied factors (i.e., the shell wall thickness and density, the size of the mantle cavity, the septal volume, and the presence of intracameral liquid) leads to a decrease in stability (i.e., inverse relationship), especially when there is a decrease in body chamber’s weight, either by diminishing the mass of the shell wall or the soft tissue (by increasing the size of the mantle cavity). This phenomenon could explain the stronger ornamentation on the adult body chamber; because the additional mass (from these elements) moves the center of mass downwards, locating it farther from the center of buoyancy, thus enhancing the stability of the organism during reproduction. However, in the scenario with a filled last chamber and a mantle cavity of 15% of the body chamber, there is a slight increase in stability, indicating that the relationship between these parameters is not linear. This is caused by a compromise between the lost mass from the increase of the mantle cavity and the extra mass added from the intracameral liquid, eventually displacing the center of mass backwards, and slightly increasing the distance with respect to the center of buoyancy. Furthermore, the stability values can be used for evaluating potential swimming capability, with increasing stability favoring greater swimming ability (Lemanis et al. 2015). The results suggest that the studied species had slightly worse swimming capabilities than Nautilus has today. Nonetheless, this kind of comparison has to be made cautiously. If we think of swimming as some aspect of horizontal motion, then even a low stability animal could swim well as long as the effective thrust vector acts through the center of rotation (as it is observed in extant squids that have a very low stability value but are great swimmers; Bartol et al. 2008). For ammonites this would be dependent on the orientation of the aperture and the flexibility of the hyponome. Additionally, more factors influence the swimming capabilities not directly related with stability (e.g., flow velocity and friction coefficients; Hebdon et al. 2020). So, further studies of the shell hydrodynamic properties of M. seymourianus are required to verify this conclusion.
Shell orientation.—Results regarding the static orientation for Maorites seymourianus models are consistent with predictions from other models proposed by previous authors (see Naglik et al. 2015: 654, fig.7.2) ranging 75–76° when the phragmocone is empty and 74–75° when the last chamber is filled (Table 6). In this case, the mass increase caused by the addition of the intracameral liquid overcomes the effect of its position, causing a slight displacement from the total center of mass towards the aperture and marginally decreasing the angle with respect to the vertical. Variation of the density, shell thickness, mantle cavity, and the addition of 20% of the septum volume, seem not to have a major effect on the aperture orientation.
Table 6. Shell orientation results for the models of Maorites seymourianus with and without an empty last chamber for the studied densities (ρ), shell thickness (T), varying the percentage of mantle cavity of the body chamber (B.C.) and the 20% increase in septa volume (S.V.) to emulate the lack of septal folding.
| |
Empty phragmocone |
Last chamber filled |
||
|
Mantle cavity |
10% B.C. |
10% B.C.+ 20% S.V. |
10% B.C. |
10% B.C.+ 20% S.V. |
|
(T = 1.5 mm, ρ = 2.5 cm3/gr) |
75.108° |
75.623° |
74.543° |
74.630° |
|
(T = 1.79 mm, ρ = 2.7 cm3/gr) |
75.806° |
76.411° |
74.472° |
74.562° |
|
Mantle cavity |
15% B.C. |
15% B.C.+ 20% S.V. |
15% B.C. |
15% B.C.+ 20% S.V. |
|
(T = 1.5 mm, ρ = 2.5 cm3/gr) |
75.224° |
75.773° |
74.596° |
74.689° |
|
(T = 1.79 mm, ρ = 2.7 cm3/gr) |
75.947° |
76.591° |
74.555° |
74.655° |
|
Mantle cavity |
20% B.C. |
20% B.C.+ 20% S.V. |
20% B.C. |
20% B.C.+ 20% S.V. |
|
(T = 1.5 mm, ρ = 2.5 cm3/gr) |
75.352° |
75.939° |
74.543° |
74.846° |
|
(T = 1.79 mm, ρ = 2.7 cm3/gr) |
76.101° |
76.789° |
74.472° |
74.758° |
From an ecologic perspective, the shell orientation in ectocochleate cephalopods is related to their ability to interact with their environment, with larger static angles hindering the capability of the organisms to interact with the substrate (Ladd 1957). This implies that the studied species probably would have inhabited the water column, suggesting a possible nektic to nektoplanktic mode of habit. A palaeoenvironment undergoing a marine transgression (i.e., a sea increasing in depth favoring nektonic adaptations to occupy the new water column; Wellborn and Langerhans 2014) inferred from the sedimentology of the López de Bertodano Formation and data from the palaeosynecology of the Marambio Group seem to support this inference (Olivero 2012; Olivero and Raffi 2018)
Conclusions
Maorites seymourianus possesses a conch geometry that can be described by a third-order polynomial function similar to an exponential equation (of a logarithmic spiral). But this function shows higher values of whorl expansion at the beginning of the curve and lower values at the end of it. This indicates a phenomenon of acceleration of the soft body growth in the first whorls and of deceleration reaching adulthood, with constant growth in an intermediate (juvenile) stage.
Maorites seymourianus models exhibit a slightly positive to negative buoyancy ranging from B = -0.0856 N to B = 0.1547 N in the highest and lowest total mass available, respectively. Lower buoyancy values are observed when there is an increase in density, shell thickness, and/or the state of the phragmocone, caused by the implicit increase in the effective weight of the model. From these results and due to the absence of some structures that increase the total mass, we estimate that the living organism would have tended to a slightly negative buoyancy.
Relatively low stability values were inferred from the models for M. seymourianus, varying between St = 0.056 to St = 0.073 from the Raup (1967) and Raup and Chamberlain (1967) Stability Index, and between Sto = 0.016 to Sto = 0.021 when the Okamoto (1996) Stability Index is considered.
Estimations regarding the shell orientation for M. seymourianus models range 75–76° with respect to the vertical when the phragmocone is empty, and 74–75° when the last chamber is filled.
The modeling method employed can be used to construct a large range of conch morphologies but shows limitations related to the modeling of morphological changes through ontogeny and complex structures, such as the ornamentation and folded septa. Replicability seems to be another subject of consideration, as variations during the modeling process may cause the need for adjustment of the array parameters, thus differing from the original virtual model that is trying to be replicated.
Acknowledgments
Authors want to thank specially to Maria Cecilia Rodríguez Amenábar (Instituto Antártico Argentino, Buenos Aires, Argentina) and Marian Tanuz (Universidad de Buenos Aires, Buenos Aires, Argentina) for the loan of specimens under their care and general assistance. Special thanks are given to the Clínica La Sagrada Familia (Buenos Aires, Argentina) and its staff, where the CT-scan studies were accomplished. We also thank Takao Ubakata (Kyoto University, Japan), and an anonymous reviewer for their time and comments that significantly improved the manuscript. Partial funding of this project come from the Minciencias, Colombia (award to DAMA) and the Deutsche Forschungsgemeinschaft grant LE 4039/1-1, Germany (to RL). This is the contribution R-337 to the Instituto de Estudios Andinos “Don Pablo Groeber” (IDEAN, UBA-CONICET).
References
Autodesk Inc. 2019. Autodesk Inventor Professional, Version 2019.4. San Rafael, California.
Autodesk Inc. 2020a. Meshmixer, Version 3.5.474. San Rafael, California.
Autodesk Inc. 2020b. Netfabb 2018.3, Version 3.5.474. San Rafael, California.
Bardin, J., Isabelle, R., and Cecca, F. 2014. Cladistics in ammonoids: Back to the future. Neues Jahrbuch für Geologie und Paläontologie Abhandlungen 274: 239–253. Crossref
Bartol, I.K., Krueger, P.S., Thompson, J.T., and Stewart, W.J. 2008. Swimming dynamics and propulsive efficiency of squids throughout ontogeny. Integrative and Comparative Biology 48: 720–733. Crossref
Blender Online Community 2019. Blender, a 3D Modelling and Rendering Package, Version 2.81. Amsterdan, Netherlands.
Bucher, H., Landman, N.H., Klofak, S.M., and Guex, J. 1996. Mode and rate of growth in ammonoids. In: N.H. Landman, K. Tanabe, and R.A. Davis (eds.), Ammonoid Paleobiology, 407–461. Springer US, Boston. Crossref
Cignoni, P., Callieri, M., Corsini, M., Dellepiane, M., Ganovelli, F., and Ranzuglia, G. 2008. MeshLab: an Open-Source Mesh Processing Tool, Version 2016.12. Pisa, Italy.
De Baets, K., Klug, C., and Monnet, C. 2013. Intraspecific variability through ontogeny in early ammonoids. Paleobiology 39: 75–94. Crossref
Erlich, A., Moulton, D.E., Goriely, A., and Chirat, R. 2016. Morphomechanics and developmental constraints in the evolution of ammonites shell form. Journal of Experimental Zoology Part B: Molecular and Developmental Evolution 326: 437–450. Crossref
Hammer, O. 2016. The Perfect Shape: Spiral Stories. 258 pp. Copernicus [published online, https://doi.org/10.1007/978-3-319-47373-4]. Crossref
Hammer, O., Harper, D., and Ryan, P. 2001. PAST: Paleontological statistics software package for education and data analysis. Palaeontologia Electronica 4 (1): 1–9.
Hebdon, N., Ritterbush, K., and Choi, Y. 2020. Computational fluid dynamics modeling of fossil ammonoid shells. Palaeontologia Electronica 23 (1): article a21 [published online, https://doi.org/10.26879/956] Crossref
Higashiura, K. and Okamoto, T. 2012. Life orientation of heteromorph ammonites under the negatively buoyant condition: A case study on the Eubostrychoceras muramotoi Matsumoto. Fossils 92: 19–30.
Hoffmann, R. 2010. New insights on the phylogeny of the Lytoceratoidea (Ammonitina) from the septal lobe and its functional interpretation. Revue de Paleobiologie 29: 1–156.
Hoffmann, R., Weinkauf, M.F.G., Wiedenroth, K., Goeddertz, P., and De Baets, K. 2019. Morphological disparity and ontogeny of the endemic heteromorph ammonite genus Aegocrioceras (Early Cretaceous, Hauterivian, NW-Germany). Palaeogeography, Palaeoclimatology, Palaeoecology 520: 1–17. Crossref
Jacobs, D.K. 1992. Shape, drag, and power in ammonoid swimming. Paleobiology 18: 203–220. Crossref
Jacobs, D.K. and Landman, N.H. 1993. Nautilus—a poor model for the function and behavior of ammonoids? Lethaia 26: 101–111. Crossref
Klug, C. and Hoffmann, R. 2015. Ammonoid septa and sutures. In: C. Klug, D. Korn, K. De Baets, I. Kruta, and R.H. Mapes (eds.), Ammonoid Paleobiology: From Anatomy to Ecology, 45–90. Springer Netherlands, Dordrecht. Crossref
Klug, C. and Korn, D. 2004. The origin of ammonoid locomotion. Acta Palaeontologica Polonica 49: 235–242.
Klug, C. and Lehmann, J. 2015. Soft part anatomy of ammonoids: reconstructing the animal based on exceptionally preserved specimens and actualistic comparisons. In: C. Klug, D. Korn, K. De Baets, I. Kruta, and R.H. Mapes (eds.), Ammonoid Paleobiology: From Anatomy to Ecology, 507–529. Springer Netherlands, Dordrecht. Crossref
Klug, C., Korn, D., Landman, N.H., Tanabe, K., De Baets, K., and Naglik, C. 2015. Describing ammonoid conchs. In: C. Klug, D. Korn, K. De Baets, I. Kruta, and R.H. Mapes (eds.), Ammonoid Paleobiology: From Anatomy to Ecology, 3–24. Springer Netherlands, Dordrecht. Crossref
Klug, C., Riegraf, W., and Lehmann, J. 2012. Soft-part preservation in heteromorph ammonites from the Cenomanian–Turonian Boundary Event (OAE 2) in north-west Germany. Palaeontology 55: 1307–1331. Crossref
Knauss, M. and Yacobucci, M. 2014. Geographic Information Systems technology as a morphometric tool for quantifying morphological variation in an ammonoid clade. Palaeontologia Electronica 17: 19A. Crossref
Korn, D. 2010. A key for the description of Palaeozoic ammonoids. Fossil Record 13: 5–12. Crossref
Korn, D., Ghaderi, A., Ghanizadeh Tabrizi, N., and Gliwa, J. 2019. The morphospace of Late Permian coiled nautiloids. Lethaia 53: 154–165. Crossref
Kulicki, C., Tanabe, K., Landman, N., and Kaim, A. 2015. Ammonoid shell microstructure. In: C. Klug, D. Korn, K. De Baets, I. Kruta, and R.H. Mapes (eds.), Ammonoid Paleobiology: From Anatomy to Ecology, 321–357. Springer Netherlands, Dordrecht. Crossref
Ladd, H.S. 1957. Treatise on Marine Ecology and Paleoecology. 1077 pp. Geological Society of America, Washington DC.
Lemanis, R., Zachow, S., Fusseis, F., and Hoffmann, R. 2015. A new approach using high-resolution computed tomography to test the buoyant properties of chambered cephalopod shells. Paleobiology 41: 313–329. Crossref
Macellari, C.E. 1986. Late Campanian–Maastrichtian ammonite fauna from Seymour Island (Antarctic Peninsula). Journal of Paleontology 60: 1–55. Crossref
Marin, F., Le Roy, N., and Marie, B. 2012. The formation and mineralization of mollusk shell. Frontiers in bioscience (Scholar edition) 4: 1099–1125. Crossref
Meinhardt, H. 1995. The Algorithmic Beauty of Sea Shells. 253 pp. Springer-Verlag, Berlin. Crossref
Monnet, C., De Baets, K., and Yacobucci, M.M. 2015. Buckman’s Rules of Covariation. In: C. Klug, D. Korn, K. De Baets, I. Kruta, and R.H. Mapes (eds.), Ammonoid Paleobiology: From Macroevolution to Paleogeography, 67–94. Springer Netherlands, Dordrecht. Crossref
Morón-Alfonso, D.A. 2019. Exploring the paleobiology of ammonoids (Cretaceous, Antarctica) using non-invasive imaging methods. Palaeontologia Electronica 22.3.57: 1–17 [published online, https://doi.org/10.26879/1007] Crossref
Mutvei, H. and Dunca, E. 2007. Connecting ring ultrastructure in the Jurassic ammonoid Quenstedtoceras with discussion on mode of life of ammonoids. In: N.H. Landman, R.A. Davis, and R.H. Mapes (eds.), Cephalopods Present and Past: New Insights and Fresh Perspectives, 239–256. Springer Netherlands, Dordrecht. Crossref
Naglik, C., Tajika, A., Chamberlain, J., and Klug, C. 2015. Ammonoid locomotion. In: C. Klug, D. Korn, K. De Baets, I. Kruta, and R.H. Mapes (eds.), Ammonoid Paleobiology: From Anatomy to Ecology, 649–688. Springer Netherlands, Dordrecht. Crossref
Okamoto, T. 1996. Theoretical modeling of ammonoid morphology. In: N.H. Landman, K. Tanabe, and R.A. Davis (eds.), Ammonoid Paleobiology, 225–251. Springer US, Boston. Crossref
Olivero, E.B. 2012. Sedimentary cycles, ammonite diversity and palaeoenvironmental changes in the Upper Cretaceous Marambio Group, Antarctica. Cretaceous Research 34: 348–366. Crossref
Olivero, E.B. and Raffi, M.E. 2018. Onshore-offshore trends in Campanian ammonite facies from the Marambio Group, Antarctica: Implications for ammonite habitats. Cretaceous Research 88: 79–89. Crossref
Parent, H., Bejas, M., Greco, A., and Hammer, O. 2012. Relationships between dimensionless models of ammonoid shell morphology. Acta Palaeontologica Polonica 57: 445–447. Crossref
Parent, H., Westermann, G.E.G., and Chamberlain, J.A. 2014. Ammonite aptychi: Functions and role in propulsion. Geobios 47: 45–55. Crossref
Peterman, D.J., Barton, C., and Yacobucci, M. 2019a. The hydrostatics of Paleozoic ectocochleate cephalopods (Nautiloidea and Endoceratoidea) with implications for modes of life and early colonization of the pelagic zone. Palaeontologia Electronica 22.2.24A: 1–29 [published online, https://doi.org/10.26879/884] Crossref
Peterman, D., Ciampaglio, C., Shell, R., and Yacobucci, M. 2019b. Mode of life and hydrostatic stability of orthoconic ectocochleate cephalopods: Hydrodynamic analyses of restoring moments from 3D printed, neutrally buoyant models. Acta Palaeontologica Polonica 64: 441–460. Crossref
Peterman, D.J., Yacobucci, M.M., Larson, N.L., Ciampaglio, C., and Linn, T. 2020. A method to the madness: Ontogenetic changes in the hydrostatic properties of Didymoceras (Nostoceratidae: Ammonoidea). Paleobiology 46: 1–22. Crossref
Polizzotto, K., Landman, N.H., and Klug, C. 2015. Cameral membranes, pseudosutures, and other soft tissue imprints in ammonoid shells. In: C. Klug, D. Korn, K. De Baets, I. Kruta, and R.H. Mapes (eds.), Ammonoid Paleobiology: From Anatomy to Ecology, 91–109. Springer Netherlands, Dordrecht. Crossref
Raup, D.M. 1967. Geometric analysis of shell coiling: Coiling in ammonoids. Journal of Paleontology 41: 43–65.
Raup, D.M. and Chamberlain, J.A. 1967. Equations for volume and center of gravity in ammonoid shells. Journal of Paleontology 41: 566–574.
Ritterbush, K.A. and Bottjer, D.J. 2012. Westermann morphospace displays ammonoid shell shape and hypothetical paleoecology. Paleobiology 38: 424–446. Crossref
Seilacher, A. and Gunji, Y.P. 1993. Morphogenetic countdown: another view on heteromorph shells in gastropods and ammonites. Neues Jahrbuch für Geologie und Paläontologie Abhandlungen 190: 237–265.
Tajika, A. and Klug, C. 2020. How many ontogenetic points are needed to accurately describe the ontogeny of a cephalopod conch? A case study of the modern nautilid Nautilus pompilius. PeerJ 8: e8849. [published online, https://doi.org/10.7717/peerj.8849] Crossref
Tajika, A., Landman, N.H., Hoffmann, R., Lemanis, R., Morimoto, N., Ifrim, C., and Klug, C. 2020. Chamber volume development, metabolic rates, and selective extinction in cephalopods. Scientific Reports 10: 2950. Crossref
Tajika, A., Naglik, C., Morimoto, N., Pascual-Cebrian, E., Hennhöfer, D., and Klug, C. 2015. Empirical 3D model of the conch of the Middle Jurassic ammonite microconch Normannites: its buoyancy, the physical effects of its mature modifications and speculations on their function. Historical Biology 27: 181–191. Crossref
Tanabe, K. and Fukuda, Y. 2010. Mouth part histology and morphology. In: W.B. Saunders and N.H. Landman (eds.), Nautilus: The Biology and Paleobiology of a Living Fossil, Reprint with additions, 313–322. Springer Netherlands, Dordrecht.
Tanabe, K., Sasaki, T., and Mapes, R.H. 2015. Soft-part anatomy of the siphuncle in ammonoids. In: C. Klug, D. Korn, K. De Baets, I. Kruta, and R.H. Mapes (eds.), Ammonoid Paleobiology: From Anatomy to Ecology, 531–544. Springer Netherlands, Dordrecht. Crossref
Tendler, A., Mayo, A., and Alon, U. 2015. Evolutionary tradeoffs, Pareto optimality and the morphology of ammonite shells. BMC Systems Biology 9: 12. Crossref
Thompson, D.A.W. 1917. On Growth and Form. 780 pp. Cambridge University Press, Cambridge.
Trueman, A.E. 1940. The ammonite body-chamber, with special reference to the buoyancy and mode of life of the living ammonite. Quarterly Journal of the Geological Society 96: 339. Crossref
Urdy, S., Goudemand, N., Bucher, H., and Chirat, R. 2010. Growth-dependent phenotypic variation of molluscan shells: Implications for allometric data interpretation. Journal of Experimental Zoology. Part B, Molecular and Developmental Evolution 314: 303–326. Crossref
Wellborn, G. and Langerhans, B. 2014. Ecological opportunity and the adaptive diversification of lineages. Ecology and Evolution 5: 176–195. Crossref
Westermann, G.E.G. 2013. Hydrostatics, propulsion and life-habits of the Cretaceous ammonoid Baculites. Revue de Paleobiologie 32: 249–265.
Acta Palaeontol. Pol. 65 (3): 467–480,
2020 https://doi.org/10.4202/app.00776.2020