
Reconstructed masticatory biomechanics of Peligrotherium tropicalis, a non-therian mammal from the Paleocene of Argentina
TONY HARPER, CALEB F. ADKINS, and GUILLERMO W. ROUGIER
Harper, T., Adkins, C.F., and Rougier, G.W. 2022. Reconstructed masticatory biomechanics of Peligrotherium tropicalis, a non-therian mammal from the Paleocene of Argentina. Acta Palaeontologica Polonica 67 (1): 177–201.
The large, bunodont, mammal Peligrotherium tropicalis is an enigmatic member of the earliest Paleocene fauna of Punta Peligro, Argentina. While being a contemporary of many of the earliest large-bodied “archaic ungulates” in the Northern Hemisphere, P. tropicalis is a remnant of an endemic Mesozoic non-therian lineage. The interpretation of P. tropicalis as an omnivore/herbivore has therefore been difficult to evaluate, given its phylogenetic placement outside of the therian clade, and lack of many of the molar characteristics thought to be essential for the forms of mastication seen in marsupials and placentals. Here we present a three-dimensional generalization of the classical “bifulcral” biomechanical model of bite force and joint force estimation, which is capable of accommodating the wide range of mediolateral force orientations generated by the muscles of mastication, as estimated by the geometry of their rigid attachment surfaces. Using this analysis, we demonstrate that P. tropicalis is more herbivorously adapted (viz. shows a greater Group 2 relative to Group 1 jaw adductor advantage for producing postcanine orthal bite forces) than even the hypocarnivorous carnivorans Procyon lotor and Ursus arctos, and is similar to the ungulates Sus scrofa and Diceros bicornis. This similarity also extends to the mediolateral distribution of relative muscle group advantage, with Group 1 muscles (responsible for effecting the initial adduction of the working-side hemimandible into centric occlusion) having greater orthal bite forces labially; and Group 2 muscles (those responsible for producing occlusal grinding motions) being more powerful lingually. Finally, we show that P. tropicalis preserves relatively little of its orthal bite force magnitude at high gape, suggesting that large-object durophagy would not have been a likely feeding strategy.
Key words: Mammalia, Meridiolestida, Peligrotherium, bifulcral, mastication, vertical kinematic phase.
Tony Harper [anthony.harper@lmunet.edu] and Caleb F. Adkins [caleb.adkins@lmunet.edu], Lincoln Memorial University, DeBusk College of Osteopathic Medicine, 9737 Cogdill Rd., Knoxville, TN 37932, USA.
Guillermo W. Rougier [guillermo.rougier@louisville.edu] (corresponding author), University of Louisville, Department of Anatomical Sciences and Neurobiology, 511 S Floyd St, Louisville, KY 40202, USA.
Received 29 May 2021, accepted 24 January 2022, available online 30 March 2022.
Copyright © 2022 T. Harper et al. This is an open-access article distributed under the terms of the Creative Commons Attribution License (for details please see http://creativecommons.org/licenses/by/4.0/), which permits unrestricted use, distribution, and reproduction in any medium, provided the original author and source are credited.
Introduction
The rigid structure of the mammalian jaw has been sculpted over evolutionary time by the selective obligation to facilitate biting, ingestion, mastication, and other depascent behaviors. At the time of their initial divergence from the sauropsid amniotes, ancestral forms of inertial feeding were likely the sole mode of mechanical processing available to the early synapsids for the preparation of ingested material. From this plesiomorphic condition, selection pressures for increasingly dynamic and efficient use of low-gape behaviors, and the distal elements of the marginal dentition, promoted the wide variety of postcanine crown morphologies and mandibular geometries that we see in mammals and their closest relatives (Bramble and Wake 1985).
The fossil record of later synapsids provides many examples of skeletal feeding adaptations, such as the simplification and strengthening of the facial region and each hemimandible, lateral flaring of the zygomatic arches, repositioning of the mandibular condyle relative to the lower postcanine tooth-row, and the presence of mediolaterally flaring pterygoid and masseteric flanges on the dentary bone (Lillegraven et al. 1979; Kielan-Jaworowska et al. 2005). These transformations seem to suggest that rotation and mediolaterally extensive translation of the mandible (relative to the skull) became increasingly important within this lineage (Grossnickle 2017, 2020). Prior investigations (Bramble and Wake 1985) have also suggested that the branchiomeric trigeminal motor pathways driving the feeding apparatus have also been evolutionarily conservative, and liable to be exapted towards complex and possibly convergent sequences of muscular activation during mastication (Crompton 1995; Gould and Vrba 1982).
This paper presents evidence for an unsuspectedly derived example of transversely elaborated mastication in a non-therian crown mammal, the early Paleocene Peligrotherium tropicalis Bonaparte, Van Valen, and Kramarz, 1993, from southern Argentina (see Figs. 1 and 2). Because of the geometrical nature of this evidence, a novel three-dimensional biomechanical method for comparing estimates of relative bite and joint forces is also presented here, allowing for size-standardized comparisons of masticatory performance between P. tropicalis and a representative sample of extant therian species. Given the phylogenetic location of P. tropicalis outside of the clade of extant tooth-bearing mammals (the therian mammals), these comparisons with modern therians should only signify functional similarities and differences between the various autecological modes of mammalian feeding, and not the recency of common ancestry among the taxa analyzed. The method described here is a three-dimensional generalization of the classic bifulcral analysis originally presented by Bramble (1978), which models each hemimandible’s transmission of attached muscle tension (treated as a concentrated input force) into compressive bite and joint forces using two simultaneous lever equations. While the Archimedean lever equation is used to solve a fundamentally planar problem, modeling hemimandibular rotation and all relevant forces within a single or several mutually parallel planes, our method is the first to not require that each individual lever equation involved with the mechanical parameterization of the jaw be coplanar (or even mutually parallel) to each other or with any particular standard anatomical plane.
Peligrotherium tropicalis (Figs. 1 and 2) is currently the sole genus recognized within its monotypic family Peligrotheriidae, and is the largest (large-dog sized) and most recent known representative of the larger South American endemic lineage of cladotherian mammals termed the Mesungulatomorpha (Rougier et al. 2011), along with the shrew-sized Reigitheriidae (Bonaparte 1990; Harper et al. 2019; Rougier et al. 2021) and the cat-sized Mesungulatidae (Bonaparte 1986; Rougier et al. 2009). All mesungulatomorphs are characterized by a reduction in postcanine dental formula, extreme development of bunodonty, and well developed lower molar cingulids. Along with the likely related Reigitherium, Peligrotherium also shows the development of labially extensive exodaenodont lobes on all three lower molar crowns, which are embellished with several neomorphic accessory cuspulids (although see Martinelli et al. 2021 for an alternative interpretation). Most importantly these two taxa have lost all capacity for embrasure shearing (Paéz-Arango 2008), the ancestral mode of oral mechanical digestion in the majority of (presumably insectivorous) Jurassic and Cretaceous cladotherian mammals. However, this shearing capacity was likely present in the more plesiomorphic members of the Meridiolestida (Rougier et al. 2011, 2012), the larger clade encompassing P. tropicalis and its closest relatives.
Based on the well-preserved material described in Paéz-Arango (2008), the postcanine dental formula in P. tropicalis is inferred to include three upper and lower premolars and three upper and lower molars, thus matching the postcanine dental formula seen in many modern eutherian groups. As also mentioned by Harper et al. (2019), several “high-level” topographic features of the lower second molar of P. tropicalis are also broadly comparable to those seen in stratigraphically younger therian mammals (in this case the herbivorously adapted polydolopomorph marsupials). In particular, Harper et al. (2019) found that P. tropicalis shows closer similarity to these Paleogene South American marsupials in the dental topographic metrics Relief Index (RFI; Boyer 2008), and Dirichlet Normal Energy (DNE; Bunn et al. 2011), than do even the most herbivorously-adapted eutherians known before the latest Cretaceous. While these broad similarities do provide some prima facie justification for extrapolating the mapping of form-function relationships found in the vast literature on mammalian feeding (based on modern therians), the large amount of apical wear seen on the cusp apices and elevated cingula/cingulids in P. tropicalis may also indicate its limitation to a more plesiomorphic (strictly orthal) mode of mastication.
Institutional abbreviations.— IMNH, Idaho Museum of Natural History, Idaho State University, Pocatello, USA; ISM, Illinois State Museum, Springfield, USA.
Other abbreviations.—For list of anatomical and biomechanical abbreviations used in text see Table 1.
Table 1. Listing of anatomical and biomechanical abbreviations used in text
|
Abbreviation |
Name |
Description |
|
au |
arbitrary unit |
arbitrary unit of magnitude, corresponding to 100 units of total muscle category input force |
|
BF |
bite force magnitude |
magnitude in arbitrary units |
|
BP-W/B |
bite plane; working-side/balancing-side |
|
|
BJ |
balancing-side joint |
BS hemimandibular center of motion (condylare) |
|
BS |
balancing-side of skull and mandible |
|
|
B-WR |
ratio of balancing-side to working-side muscle activation |
here set to 0.33 for all muscle categories |
|
BV |
bite vertex |
a point on working-side lower postcanine toothrow and fulcrum for motion in each BP-W/B |
|
CG |
closed gape |
approximately at centric relation |
|
CP |
condylar plane |
|
|
DM-W/B |
deep masseter MC; working-side/ |
|
|
DMR |
direction of maxillary resistance |
the occlusal up direction at closed gape |
|
G1 |
Group 1 MCs |
muscles effecting Phase I motion |
|
G2 |
Group 2 MCs |
muscles effecting Phase II motion |
|
ILBP-W/B |
in-lever in bite plane; working-side/balancing-side |
|
|
ILCP-W/B |
in-lever in condylar plane; working-side/balancing-side |
|
|
LOA |
line of action |
direction of pull, intersecting attachment centroids for a particular muscle category |
|
MBG |
maximal bony gape |
as defined in Fricano and Perry 2019 |
|
MC |
muscle category |
one of eight jaw adductor muscle groupings, defined in text |
|
MDL |
mesiodistal location |
ratio indicating each point’s mesiodistal location in postcanine toothrow |
|
MP-W/B |
medial pterygoid MC; working-side/balancing-side |
|
|
OG |
open gape |
approximately maximal bony gape, but see text description |
|
OLBP-W/B |
out-lever bite plane; working-side/balancing-side |
|
|
OLCP-W/B |
out-lever condylar plane; working-side/balancing-side |
|
|
P1 |
Phase I |
Phase I of the masticatory power stroke |
|
P2 |
Phase II |
Phase II of the masticatory power stroke |
|
PCSA |
physiological cross section area |
|
|
PD |
distal point |
point defining the distal end of the working-side postcanine toothrow |
|
PM |
mesial point |
point defining the mesial end of the working-side postcanine toothrow |
|
PT-W/B |
posterior temporalis MC; |
|
|
SCF |
static correction factor |
multiplier for output forces to
ensure force equilibrium |
|
SF |
stretch factor |
|
|
SM-W/B |
superficial masseter MC; working-side/balancing-side |
|
|
TR |
working-side lower postcanine toothrow |
lower crown surfaces between PM and PD |
|
WJ |
working-side joint |
working-side hemimandibular center of motion (condylare) |
|
WS |
working-side |
working-side of skull and mandible |
Geological setting
Peligrotherium tropicalis comes from the western exposures of the “banco negro inferior” within the Hansen Member of the greater Salamanca Formation. This sedimentary facies represents a brief episode of brackish, shallow water sedimentation in the wider history of the Salamancan Sea, the first marine transgression recorded in the San Jorge basin of southern Patagonia, Argentina (Andreis et al. 1977). The paleofauna of Punta Peligro, an irregular peninsula which has yielded specimens of P. tropicalis and a wide variety of other vertebrate taxa, is based on several localities located approximately 27 km northeast of Comodora Rivadavia in southern Chubut Province, Argentina. This region has been commemorated as the stratotype for the Peligran South American Land Mammal Age (SALMA) by Bonaparte et al. (1993), and considered to represent later early Paleocene time (postdating the Tiupampan and preceding Carodnia Zone beds). Later authors (Marshall et al. 1997) have proposed an earliest Paleocene age for the Peligran SALMA, somewhat older than the Tiupampan, but for the following discussion the original age attribution for P. tropicalis and its associated paleofauna is assumed here.
Being a large-bodied, early Cenozoic, bunodont mammal, the original taxonomic attribution of P. tropicalis by Bonaparte et al. (1993) to an aberrant condylarth lineage with close affinities to periptychids is very understandable. Only with the detailed morphological analyses provided by Gelfo and Pascual (2001), Paéz-Arango (2008), and Rougier et al. (2009), has it become clear that P. tropicalis (along with the Miocene Necrolestes patagonensis; Rougier et al. 2012; Wible and Rougier 2017) represents one of the latest known surviving lineages of the non-therian South American group Meridiolestida. While the precise derivation of Meridiolestida from the cosmopolitan, mainly Jurassic and Cretaceous, clade Dryolestoidea has recently been called into question (Averianov et al. 2013), the meridiolestidans can be placed uncontroversially within the crown mammalian clade Trechnotheria, and within Trechnotheria are most likely members of Cladotheria, a group that prior authors (e.g., Crompton et al. 1994; Schultz and Martin 2014; Grossnickle 2017, 2020) have suggested to be characterized by the apomorphic capacity for increased mediolateral mandibular excursion and rotation relative to more rootward stem-therian plesions.
Historical background
The fact that the non-tribosphenic mammal Peligrotherium tropicalis has so closely approximated the size, robustness, and gestalt dental morphology of paracontemporaneous therian taxa (see Fig. 1) naturally presents the hypothesis that some or all of the behavioral and mechanical characteristics of the elaborate mastication seen (or inferred) in therian omnivores and herbivores may also have been present in Peligrotherium as well (due either to convergence or synapomorphy). Preliminary reports on phylogenetically wide-scale correlations between mandibular morphology and electromyographic activity in therians (Vinyard et al. 2011; also see Hylander and Johnson 1994) have suggested that increased surface area of the mandibular symphysis in particular is a fossilizable character correlated with decreased working-side (WS) relative to balancing-side (BS) activity ratios of the deep masseter muscle (Vinyard et al. 2011), and especially with increasing time delays of the peak activity between the WS and BS deep masseter (Vinyard et al. 2011; Williams et al. 2008; Crompton et al. 2010). The wide, rugose (but unfused) mandibular symphysis in P. tropicalis therefore provides at least prima facie evidence for a type of unilateral, asymmetric, and temporally prolonged rhythmic chewing pattern characteristic of modern omnivores and herbivores in the “transverse chewing” group of modern therians (Vinyard et al. 2011). The goal of this report is to describe additional independent evidence for transverse chewing capabilities in P. tropicalis based on the geometrical characteristics and general robusticity of the craniomandibular morphology apparent in the fragmentary material known for this taxon (Fig. 2). We also discuss the likelihood of these adaptations being the elaboration of behavioral symplesiomorphies retained from the cladotherian common ancestor, convergence in mandibular function promoted by similar ecological habit, or some combination of both. Both the modern therian and “pre-mammalian” synapsid feeding apparatus have been the focus of many biomechanical studies modeling the relative motion of the skull and mandible as an inertially dampened third-class lever system (i.e., where parameters such as mass and velocity are considered negligible and input muscular forces are applied between their fulcrum and resistance; Greaves 2012). While mechanically simplistic, this model has concisely explained many seemingly paradoxical evolutionary trends and arrangements of craniomandibular geometry in fossil taxa, such as the concurrent enlargement of the jaw adductor musculature and diminution of the jaw joint(s) and postdentary elements in advanced cynodonts, and the unexpectedly weak bite forces generated by saber-toothed cats (Crompton and Hylander 1986; McHenry et al. 2007). These studies have also had considerable success in discovering dietarily relevant patterns of force distribution within the tooth-rows of their respective focal taxa, but have had a limited capacity to comment on longer-term trends in the evolution of the mammalian jaw. This is because of the lack of such studies on non-therian crown mammals (such as monotremes and many Mesozoic lineages; although see Wall and Krause 1992 and Grossnickle 2017), and the restricted estimation of lever-arm-lengths and vectors in a reduced subset of the three orthogonal anatomical planes through the cranium. However, experimental kinematic and myographic results from a wide range of extant therians suggest that jaw motions (and their causal forces) directed obliquely in the transverse and coronal planes may have been emphasized in even very plesiomorphic stem therian lineages (Crompton 1995; Grossnickle 2017, 2020; Jäger et al. 2020).
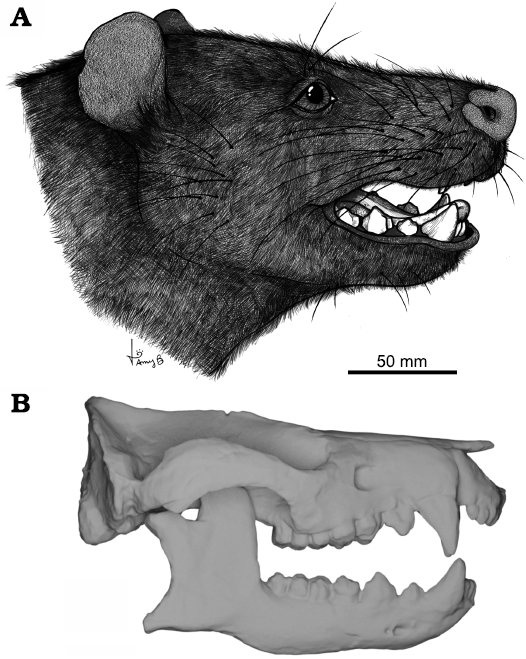
Fig. 1. Reconstruction of cranial eidonomy and osteology of the meridiolestidan mammal Peligrotherium tropicalis Bonaparte, Van Valen, and Kramarz, 1993, Punta Peligro, Argentina, Early Paleocene. A. Illustrated life reconstruction (courtesy of Amy Bishop). B. Digitized skull and mandible reconstructions produced by Paéz-Arango (2008).
From these prior leverage analyses several phylogenetically widespread geometric adaptions (having the effect of increasing the mechanical advantage of the jaw apparatus) have become apparent (Greaves 1995, 2012). These include (i) increasing the relative distance between the muscular effort resultant(s) and the mandibular fulcrum (condyle); and (ii) decreasing the distance of food resistance points (viz. the tooth crown surface) from this same fulcrum. However, the wide variety of oblique directions with which the muscles of mastication can impart motion to an adducting mandible suggest that there is an equally wide evolutionary scope for the modulation of lever-arms, bite forces, and joint forces, through the mediolateral reorientation of muscle effort vectors. The ability to measure lever-equation parameters within a natural three-dimensional context therefore seems especially important for understanding the evolutionary trends within many Mesozoic crown mammalian lineages. For example, many Mesozoic groups independently reduce the mechanical linkages between the dentary bone and middle ear elements, thereby gaining greater capacities for novel relative motions of the mandible (e.g. roll and yaw), and for asymmetrical muscular recruitment during rhythmic chewing (Crompton and Hiiemae 1970; Hiiemae and Crompton 1985; Crompton 2011; Grossnickle 2017, 2020; Jäger et al. 2020). Because the Paleocene P. tropicalis is a large but fairly plesiomorphic representative of one of these non-therian crown mammalian lineages (with detached postdentary elements and a complex postcanine dentition) the biomechanical approach used in this report is to analyze reconstructed jaw adductor leverage in its full three-dimensional context, accommodating for differential recruitment of working- and balancing-side musculature, and hypothetical Phase I (P1) vs. Phase II (P2) activity patterns of the masticatory power stroke where appropriate (Ross and Iriarte-Diaz 2019).
Although side-view (norma lateralis) photographs of associated skulls and mandibles have historically been the fundamental data for static mechanical studies of jaw function (see Fig. 2A), triangulated three-dimensional surfaces provide a more informative and geometrically unbiased basis with which to study the masticatory apparatus (Davis et al. 2010; Santana et al. 2010; Lautenschlager 2013). The widening availability of research quality three-dimensional surface files and image stacks accessioned in online repositories such as Morphosource (www.morphosource.org) has also made this type of information increasingly available for a wide variety of purposes.
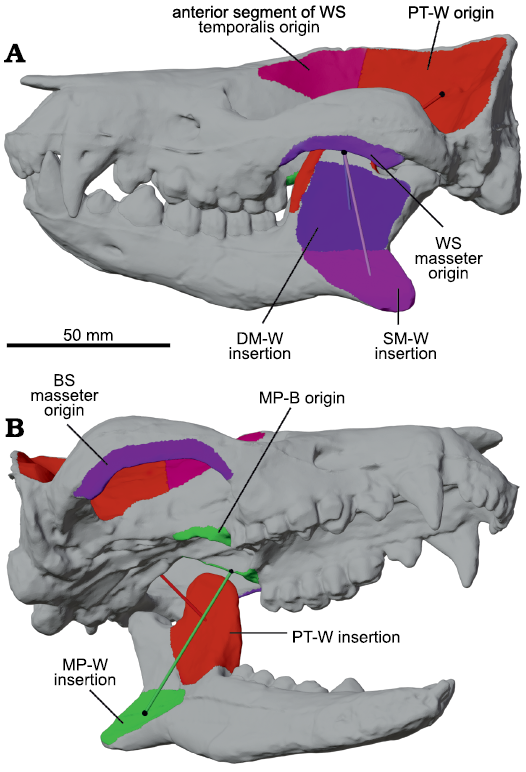
Fig. 2. Reconstructed skull and hemimandibles of meridiolestidan mammal Peligrotherium tropicalis Bonaparte, Van Valen, and Kramarz, 1993(digitized from models produced by Paéz-Arango 2008). A. Skull and mandibles articulated into closed gape position and showing the attachments of several major muscle groups. B. Right-inferior oblique view of lower left hemimandible and skull in open gape position. Here the left side of the skull is assumed to be the working-side (WS), and the right side the balancing-side (BS); see Tables 1 and 2. Colored tubes are the lines-of-action of their respective muscle category; matching colored surfaces represent corresponding estimated origin and insertion areas; and black spheres show the locations of corresponding origin or insertion centroids. Abbreviations: DM-W, deep masseter working-side; MP-W/B, medial pterygoid working-side/balancing-side; PT-W, posterior temporalis muscle category working-side; SM-W, superficial masseter working-side.
Material and methods
Comparative sample.—For this report, digital image stacks and surface meshes for a sample of twelve comparative therian specimens (see Figs. 3 and 4 for examples) were downloaded from previously published projects accessioned on Morphosource. The citations for these original publications, and for previously published anatomical depictions of the muscles of mastication in these and related taxa, are listed in the following paragraphs.
Surface data for Didelphis marsupialis (Fig. 3) was provided by Martín-Serra and Benson (2020), and the approximate muscle maps for Didelphis are inferred from Hiiemae and Jenkins (1969), and more explicitly Turnbull (1970). Similarly surface data for Erinaceus europaeus was provided by IMNH, with muscle attachments inferred based on the related Echinosorex gymnura (Turnbull 1970). Unpublished image data for the skull of a juvenile Tupaia sp. was also provided for unrestricted download by the Evolutionary Anthropology Department of Duke University, and corresponding myological photographs and illustrations were used from a recent dissertation by Krisjohnson (2019).
The suoid omnivores Sus scrofa and Tayassu pecari were provided by Alexander Prucha at George Washington University, and IMNH, respectively. Myological information for suids was taken from Herring and Scapino (1973) and Kneepkens and MacDonald (2010); and the muscle maps figured for Pecari tajacu in Woodburne (1968) were used as a guide for Tayassu pecari. Image stacks of two large herbivorous perissodactyls, the quagga (Equus quagga quagga) and black rhinoceros (Diceros bicornis, Fig. 4C, D), were acquired from Zhou et al. (2019); with muscle diagrams provided by Turnbull (1970) for Equus ferus caballus (although see below). Additionally, Beddard and Treves (1889, for Dicerorhinus sumatrensis) and Bressou (1961, for Acrocodia indica) were taken as guides for muscular attachment in both the sampled perissodactyls.
It should be mentioned at this point that the sampled therians chosen to represent “herbivores” in this study are all colloquially categorized as members of a “transverse chewing” group (Vinyard et al. 2011), a categorization that, in terms of overall diversity, the majority of herbivorous mammal species throughout time would not correspond to. The incredible diversity of clades that emphasize proal (e.g., many rodents and elephantids) and palinal (e.g., the extinct multituberculates) movements during mastication clearly demonstrates that unilateral horizontal motions of the mandible are not prerequisite for a successful plant-based feeding strategy. We have left these clades out of consideration, because P. tropicalis lacks distinctive features of the skull and dental wear that characterize proal or palinal mastication in extant therians.
The hypercarnivorous feliform carnivorans Puma concolor and Crocuta crocuta were provided by the ISM, and IMNH, respectively. Muscle attachment information was estimated from the description of Felis in Turnbull (1970) and the large cats in Hartstone-Rose et al. (2012) for Puma concolor, and from Buckland-Wright (1969) for Crocuta crocuta. Finally, surface files for the three hypocarnivorous carnivorian taxa Canis familiaris, Procyon lotor, and Ursus arctos were provided by Tseng et al. (2016), with associated myological illustrations taken from Evans and De Lahunta (2016) for Canis familiaris, Gorniak (1986) for Procyon lotor, and Davis (1955, 1964), and Endo et al. (2003) for Tremarctos ornatus, Ailuropoda melanoleuca, and Ursus thibetanus.
The reconstructed skull and associated hemimandibles of P. tropicalis (Figs. 1B and 2) were created as part of the original description of specimens in Paéz-Arango (2008: fig. 22). This reconstruction (a series of plastic casts) was surface scanned using a HDI Advance white light surface scanner located at The Johns Hopkins University Center for Functional Anatomy and Evolution. Because of the lack of prior myological estimations for P. tropicalis, attachment areas for the muscles of mastication were approximated based on preserved local topography and using the anatomy of Didelphis and Lautenschlager et al. (2017) as guides.
For all of the modern comparative taxa with only image Z-stack data archived on Morphosource, surface files (STLs) were generated using python wrapper utilities provided through the free and open-source graphical library Visualization Tool Kit (VTK; Schroeder et al. 2006), in particular the function vtkMarchingCubes. All downloaded and algorithmically generated surfaces and the scanned surface of Peligrotherium, were further remeshed to ensure manifold topology in the regions analyzed, and to evenly redistribute and reduce triangle count, using the free mesh editors Meshmixer (Autodesk, California) and Blender (www.blender.org; Sutton et al. 2016).
Group 1 vs. Group 2 analysis.—Using this surface data, a novel biomechanical analysis is presented here as a three-dimensional generalization of the bifulcral model of mandibular mechanics pioneered by Bramble (1978) (see also Greaves 2012; and Fig. 3A). The novel characteristic of our bifulcral method is the use of two lever equations which exchange the positions of the load point and fulcrum across either side of a single input effort vector (Fig. 3B: the red tubular arrow corresponding to MP-W), and allow output forces to act in separate planes (the blue and green planes in Fig. 3B). The working-side (WS) hemimandible is therefore modeled as two third-class levers simultaneously. For each particular muscular input force this model then defines two simultaneous lever equations which can be analytically solved for output forces (a bite force and a joint force; Fig. 3B: BF, JF-W) corresponding to arbitrary positions of the bite point (tooth-food contact point), center of rotation during adduction (hypomochlion; Fig. 3B: point 5), and point of application for muscular tension (Fig. 3B: point 3). For any given geometric relationship between these three points and effort vector (magnitude and orientation) a corresponding bite force magnitude can be calculated using the classical equation modeling the hemimandibular center of rotation as a fulcrum, and bite point (a location on the lower postcanine tooth-row, referred to as a BV for “bite vertex” as in Fig. 4B) as the point of application of the occlusal bite force. For this first lever equation, pertinent lever-arms are parallel to the plane containing both the muscular input vector and condylar fulcral point (here called the condylar plane, CP, shown as a transparent green triangular plane in Fig. 3B). So, for instance the “in” lever-arm of the condylar plane (Fig. 3B: ILCP-W) is defined as the perpendicular distance between the muscular effort vector and condylar fulcrum, whereas the “out” lever-arm in this plane (OLCP in Fig. 3B) is defined as the distance from the condylar fulcrum to the projection of the bite point (BV) into the CP. The perpendicular distance of the BV to the CP (the distance between point 2 and the base of the BF vector) is inconsequential with respect the calculation of its leverage. The orientation of the output bite force vector can also be determined as being perpendicular to (a cross product of) a vector representing the OLCP and the normal vector of the CP.
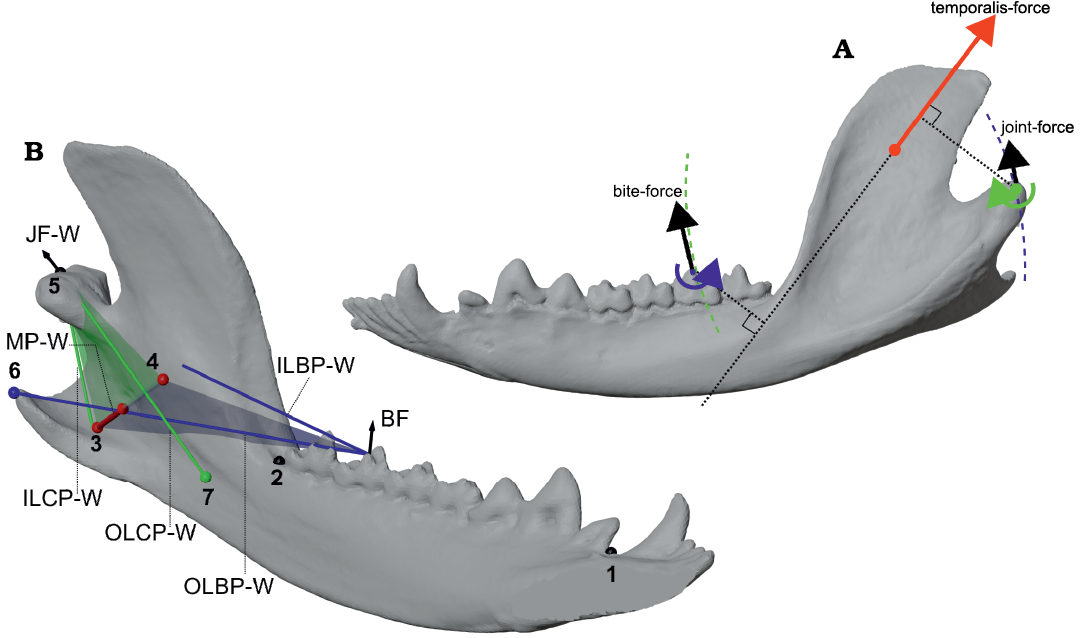
Fig. 3. Comparison of 2D side-view and fully 3D definitions of parameters for the bifulcral model of mandibular leverage, shown using Didelphis marsupialis Linnaeus, 1758 as an example. A. Left side-view of mandible in closed gape position, showing the locations of the working-side condylar fulcrum (green) and bite point fulcrum (blue). The example temporalis force vector (red) drives rotation about both of these fulcra, and produces output force vectors that are tangential to circles centered on their respective fulcra (dashed arcs). B. Oblique lingual view showing important points and lever arms corresponding to the working-side medial pterygoid force (MP-W; shown as a red arrow) using a fully three-dimensional model of bifulcral mandibular leverage. The very medially directed line-of-action for the medial pterygoid demonstrates the large differences in orientation between the condylar plane (CP; shown with a green transparent plane), bite plane (BP; shown with a blue transparent plane), and a parasagittal (side-view) plane. The three-dimensional bifulcral model calculates bite forces and joint forces by projecting load points into their respective planes, as distances perpendicular to these projections do not affect leverage calculations. Definition of numbered points: 1, mesial postcanine point (PM); 2, distal postcanine point (PD); 3, centroid of insertion area for working-side medial pterygoid (MP-W); 4, centroid of origin surface for MP-W on skull; 5, location of working-side joint (WJ); 6, projection of WJ into BP; 7, projection of an example bite vertex on the third lower molar into the CP. Abbreviations: BF, bite force; ILBP-W, in-lever of the bite plane on the working-side; ILCP-W, in-lever of the condylar plane on the working-side; JF-W, joint force on the working-side; MP-W, medial pterygoid working-side; OLBP-W, out-lever of the bite plane on the working-side; OLCP-W, out-lever of the condylar plane on the working-side. Not to scale.
The second lever equation corresponding to a particular muscular input in the bifulcral model treats the BV as the fulcrum of a third-class lever which imparts an output joint force (JF; as in Figs. 3B and 4A) at the corresponding condylar center of motion (therefore, opposite the situation in the first lever). The input muscular effort vector and its point of application within the hemimandible remain the same as in the first lever equation described in the previous paragraph (the red arrow, corresponding to MP-W, and point 3, respectively in Fig. 3B; and the red arrow in Fig. 4A). However, for this lever equation the CP is not the appropriate plane within which to measure input and output lever-arm lengths relevant for the production of JF; and a second plane (here called the bite plane, shown as a transparent blue triangular plane in Fig. 3B, and in light green and pink for Diceros bicornis in Fig. 4B) is defined as the plane containing the BV fulcrum and muscular line of action. The BP is used for the calculation of lever-arm distances and output vector orientations relevant for the estimation of joint force. This differentiation of CP and BP represents our method’s main point of departure from the classical bifulcral model presented in Bramble (1978), Greaves (2012), Hartstone-Rose et al. (2012), inter alia, as in these analyses the estimation of all lever-arm distances and vector orientations were calculated within a single, parasagittal (lateral-view) plane (e.g., compare the mechanical models of Fig. 3A and B). The reliance on photographic data with a standard orientation has required that many prior analyses prescind potentially important geometric variation inherent in the mediolateral positioning of muscular attachments and their corresponding effort vectors. The three-dimensional surfaces used here allow for each muscular effort vector (categorized into eight major jaw adductor groups, described below) to define the orientations within which parameters of the relevant lever equations should be calculated, and do not restrict these vectors to a parasagittal orientation (e.g., the oblique orientations of the CP and BP seen for Diceros bicornis in Fig. 4B). Since a muscular line-of-action (LOA; for example, between points 3 and 4 in Figs. 3B, 4) defines the single line in 3D space which is shared by both the CP and BP, the orientation of each muscular effort vector has the potential to drastically modify the lengths of all four of its corresponding lever arms and magnitudes of its two output forces. This mediolateral modulation acts in addition to the variability exhibited by the relative heights of the bite point, muscular insertion centroid and mandibular condyle, and the rostrocaudal component of the corresponding muscle resultants focused on in prior analyses (Grossnickle et al. 2021). The fact that neither the WS or BS condyle are generally located within the BP also requires these points to be projected into the BP (e.g., Fig. 3B: point 6) for calculation of the relevant bifulcral “out” lever-arm distance (OLBP-W for the WS as seen in Fig. 3A; and OLBP-B for the BS), similar to the calculations for the CP lever equation. Also, as in the CP lever equation, the orientation of each joint force vector (vectors corresponding to JF-W and JF-B for the WS and BS, respectively) is calculated by taking the cross product of the normal vector of the BP and a vector representing the OLBP-W or OLBP-B, for either the working or balancing-side (see WS joint forces illustrated in Fig. 4A).
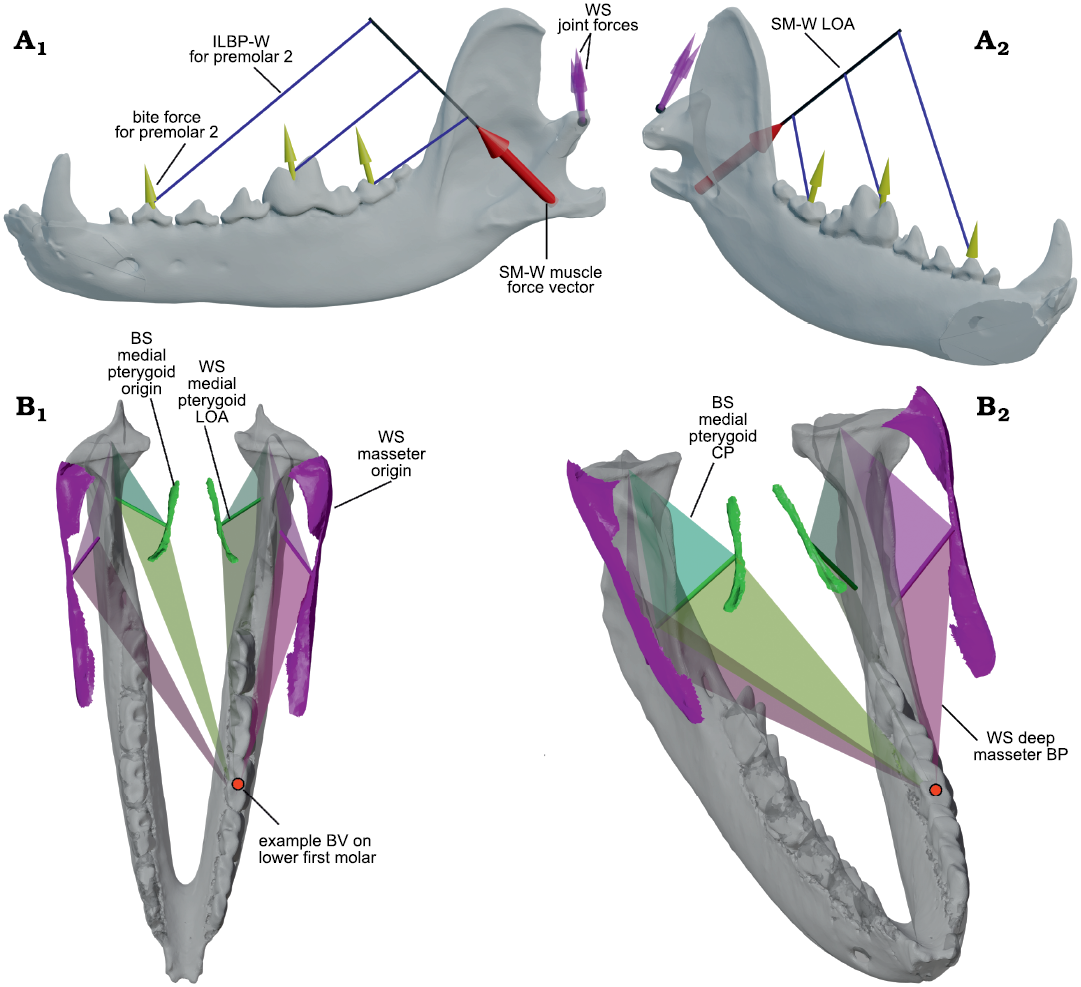
Fig. 4. Example 3D renderings of the bifulcral mandibular leverage parameters used in this analysis. A. Example of bifulcral lever arms corresponding to the working-side superficial masseter (SM-W) shown in a semi-transparent hemimandible of Canis familiaris Linnaeus, 1758; the muscular resultant vector is shown as a red arrow, with corresponding bite force vectors (yellow arrows) and working-side joint force vectors (purple arrows) shown for three positions on the lower postcanine tooth row. As can be seen, the in-lever lengths around the bite point fulcra (used in the calculation of joint force) increase significantly mesially. In labial (A1) and oblique (A2) views. B. Example of the varying condylar planes (CP) and bite planes (BP) used in the 3D bifulcral analysis, shown in Diceros bicornis (Linnaeus, 1758) for a bite point on the lower first molar. The mandible is shown in semi-transparent gray, while the working- and balancing-side origin surfaces for the deep masseter muscles on the skull are shown bilaterally in solid pink; similarly, the isolated origin surfaces of the medial pterygoids are shown in solid green. The muscular lines of action (LOA) for these four muscles are also shown as solid tubes, while transparent triangles demonstrate the orientations of the CP and BP for the corresponding muscle. In superior (B1) and oblique (B2) views. Not to scale. Abbreviations: BS, balancing-side; BV, bite vertex; ILBP-W, in-lever of the bite plane on the working-side; SM-W, superficial masseter working-side; WS, working-side.
In the models used here, muscular effort during mastication and jaw adduction at wide-gape is categorized into four partitions per side, here termed muscle categories (MCs). These are the superficial masseter (SM), deep masseter (DM), medial pterygoid (MP), and posterior temporalis (PT) categories for both the WS and BS of the cranium (SM-W, DM-W, MP-W, PT-W, and SM-B, DM-B, MP-B, PT-B; making eight forces in total). While SM-W/B, and MP-W/B forces correspond to the force vectors elicited from homogenous activation of motor units within the muscles of the same name (Druzinsky et al. 2011), DM-W/B and PT-W/B are groupings of potentially several separate homologous muscular bellies, which must be considered in aggregate because of our inability to resolve the discrete attachment areas of the component muscles of these MCs using only surface models of the skull and mandible. All these MCs correspond to the composition of Group 1 (G1) and Group 2 (G2) chewing muscles as described by Crompton (2011) for Didelphis. These “Groups” are conceptual extensions of the original functional segregation of the muscles of mastication into “Triplets” defined by Weijs (1994). The differential activation of these “Triplets” produces the dorsolateral and dorsomedial motions of the working-side hemimandible during the “power stroke” vertical kinematic phase of a generalized mammalian rhythmic chewing cycle (Ross and Irarte-Diaz 2019). As mentioned above, the treatment of the DM and PT MCs used here differs from the original formulation of Crompton (2011) in that DM incorporates all zygomatic arch muscles which are not the superficial masseter or a subdivision of the temporalis (most importantly we include zygomaticomandibularis in DM). Additionally, our inability to reliably distinguish mutually exclusive origination areas for SM-W/B and DM-W/B in the ventral zygomatic arch requires that the same area of masseteric origination be used as the origin area for both of these MCs.
To estimate the attachment of the “posterior temporalis” mentioned by Crompton (2011) for Didelphis virginiana, we have developed a “temporalis cutter” algorithm which isolates a posterior subdivision of the area of muscular origination for all temporalis muscles (such as superficial temporalis, deep temporalis, and zygomatic temporalis) by clipping the total temporalis origination area with a plane running through the coronoid processes. We therefore operationally define the “posterior temporalis” origin as the section of all subdivisions of the temporalis originating posterior to this plane. This plane is also inclined craniocaudally to follow the average inclination of the vectors connecting the centroid of the temporalis insertion area to the apical tip of each coronoid process, on both the WS and BS. The apical tips of the WS and BS coronoid process are therefore landmarks which need to be placed by hand on the surface of each hemimandible. Averaging the coronoid-centroid vectors from both sides removes the mediolateral (yaw) orientation of this clipping plane (for example see Fig. 2A: PT-W).
The protocol for producing standardized estimates of the three-dimensional orientation and magnitude for each of four MC input forces, on both the WS and BS, utilized the mesh-editing and scripting capacities provided by the free and open-source graphics program Blender (version 2.8+; see above). In particular, the capacities for computation on the geometry and connectivity of mesh objects provided by the blender-python API (Application Programming Interface; in particular the modules bpy and bmesh) and efficient mathematical utilities for scalar and array variables provided by base packages in python (e.g., numpy; www.python.org), make Blender an ideal environment within which to conduct biomechanical and morphometric analyses on the geometry of digitized surfaces of all kinds.
For P. tropicalis and all 12 comparative therian taxa, associated surface files of the skull and both hemimandibles were imported into Blender and manipulated into a “closed gape” (CG) relationship simulating the “intercuspital phase” of mastication (i.e., near centric relation; Ross and Irarte-Diaz 2019). Once the associated skull and jaw surfaces were translated and rotated into this natural CG position, changes were applied and a python script was used to scale all surfaces to a standard size based on the geometric mean of the skull’s maximum dimensions (all points in the skull and jaw surfaces were scaled by the reciprocal of the cube root of the product of the skull’s maximum length, mediolateral width, and dorsoventral depth). Changes were applied before and after this operation, and in general it is important to make sure that all transformations are applied to Blender mesh objects before proceeding with the analyses described below.
The geometric-mean size-scaling is necessitated by the current lack of published information on the Physiological Cross-Sectional Area (PCSA) in the muscles of mastication for the taxa analyzed (especially the extinct Peligrotherium), and our consequent inability to work with absolute estimates of muscle force (given the empirical average of ~0.3 N per square millimeter) of skeletal muscle PCSA in mammals (Close 1972). For comparative purposes, our operational solution to this problem is to assign a standard 100 au of muscle force per size-standardized taxon, distributed to each respective MC proportional to its relative combined surface area (origin + insertion) and a balancing- to working-side muscle recruitment ratio (B-WR). For this analysis B-WR is uniformly assumed to be 0.33 for all sampled taxa (e.g., a 3.0 WS-BS ratio or 0.75 WS/total force ratio). In the absence of taxon-specific values for B-WR, this value was chosen to represent an estimate of W-BR in an “unspecialized” living therian, (and in particular based on the “ratio of working to balancing-side muscle force” during isometric biting at the postcanine dentition, as estimated by Hylander (1979) for Otolemur crassicaudatus, through a combination of geometric, bite force, and bone-strain analyses). The current lack of published measurements or even rough approximations of B-WR for most therian species makes the uniform application of B-WR = 0.33 a conservative assumption, as choosing more extreme values (e.g., B-WR ~1 or 0) for more derived taxa (having either elaborate asynchronous chewing kinematics, or no recruitment of balancing-side musculature at all) could artificially bias differences among these forms. Conversely our uniform application of an empirical B-WR estimate from a relatively unspecialized, omnivorous, placental mammal is an approximation that will, in aggregate, minimize the deviations of each individual sampled taxon’s unknown B-WR with the operationally assumed value of 0.33. Our reasoning for making this operational assumption is based on our desire not to (i) include an MC-specific balancing-working ratio in our model, and (ii) not wanting to speculate on individual values of B-WR for each sampled taxon that has not been the subject of a detailed feeding study (the vast majority of our N = 12 comparative taxa, and P. tropicalis). This would necessitate the introduction of four wholly unknown parameter values for each taxon (taxon-and-MC-specific balancing-working ratios), as opposed to the reasonable approximation of just one value for our whole sample. In the case of Sus scrofa and Didelphis marsupialis it is likely that justifiable aggregate B-WR values could be calculated through a weighted sum involving the ratios of empirically recorded electromyographic voltages in individual muscles of mastication observed during rhythmic chewing, given the long and rigorous literature on the physiology of feeding in these genera (e.g., Crompton and Hiiemae 1970; Herring and Scapino 1973). Given the exploratory nature of our analysis overall, we are hesitant to introduce a novel method for the estimation of one or more balancing-working ratios, or to introduce systematically biased taxon-specific balancing-working ratios into our model to accommodate estimates for just two sampled taxa. We hope that empirical values of B-WR will soon be available in the literature for a wide range of therian species, allowing us to incorporate taxon-specific data of this type in future analyses.
The use of arbitrary standard units for the strength of muscle contraction also requires that the measurement of lengths used in the calculation of force moments (a force magnitude multiplied by a corresponding distance to a fulcrum perpendicular to it) also be standardized to values which are comparable across all taxa sampled. Therefore, the standardization and scaling protocol used here produces results which allow for comparisons of mechanical advantage (a unit-less quantity) and the distribution of relative bite force and joint force orientations and magnitudes across taxa, gapes (open and closed), and P1 vs. P2 muscle recruitment scenarios, for varying BV points along the lower working-side postcanine tooth-row (TR; e.g., between points 1 and 2 in Fig. 3B). However, because all pertinent lever equations are parameterized in terms of these arbitrary standard magnitudes, estimates of derivative magnitude and torque values cannot be related to their absolute physical units (newtons and newton-meters, respectively). Additionally, because of the wide variation in mandibular shape (presumably with geometrical functional implications), linear distance measurements of the mandible were not incorporated into the calculation of the size-scaling factor used to standardize the size of the cranial meshes studied.
The LOA for each muscular force vector was approximated by a line connecting the centroids of the origin and insertion attachment areas for each MC (e.g., Fig. 3B: points 3 and 4). These attachment areas were approximated using the face selection tool in Blender’s edit mode to “paint” the areas corresponding to each MC’s rigid enthesis area. This operation was done by hand using the comparative and myological sources for each taxon (listed above) and local bony topography as a guide in delimiting each MC’s attachment area. The ability to freely paint measurable areas on to digitized meshes of the skull and mandible is both a strength and weakness of this three-dimensional approach, as the lack of practical limitations on the ability to designate bony surfaces as attachment areas will likely introduce some amount of inter-observer variation into the shape and extent of each MC attachment area. However, only the relative muscle magnitude (a ratio between 0.0–1.0), and the 3D position of each attachment’s centroid (an average of many vertex coordinates included in an attachment surface) are directly influenced by the extent of “painted” surface assigned to a MC’s attachment area. This is an important consideration because inter-observer error introduced by moderately imprecise mesh editing, especially along boundaries, cannot dramatically alter the estimation of these values and downstream calculations dependent on them. For instance, since the centroid of an MC attachment area is the average of the coordinates of many surface vertices, inter-observer variation in the exact inclusion or exclusion of particular vertices at the margins of the attachment area will have only a minor effect on the location of the area’s centroid, unless those variably included vertices encompass an exorbitant amount of area or are located inordinately far from the other vertices.
Another, more severe, limitation of the method presented here is its current inability to account for (the likely extensive) attachment of the jaw adductor musculature to the dense connective tissues investing the skull and mandible in vivo. There are many known forms of such tendinous jaw muscle attachments, such as those seen in the temporal fascia and bodenaponeurosis (Crompton and Hylander 1986; Werneburg 2013), or in the internal tendinous ultrastructure of the masseter and medial pterygoid (Druzinsky et al. 2011; most important for this analysis would probably be the “tendinous bar” within the masseteric insertion of Equus described by Turnbull 1970). While this is obviously an undesirable situation, it is a disadvantage shared with all prior 2D and 3D geometrical analyses of mammalian masticatory leverage; and unlike prior analyses, the graphical approach presented here can very conceivably be extended in the future to incorporate information on the soft anatomy of tendinous structures in the feeding apparatus using the mesh editing capabilities of Blender. While the neglect of tendinous attachments has an unknown effect on estimates of muscle vector orientation, the results produced here are at least comparable in this way to those reported in prior literature.
The orientation of the LOA for each of the eight MCs was used to create unit vectors following the “point load” method described above (also see Davis et al. 2010). The magnitude of these unit vectors was then scaled (multiplied) by several coefficients to be proportional to (i) the total available muscle magnitude (100au), (ii) the relative magnitude of each MC, and (iii) the B-WR, thus ensuring that the total amount of combined MC muscle magnitude input equaled 100 au at CG. Each MC vector is therefore treated as a concentrated force by modeling the centroid of each MC’s insertion area as the point of application for its corresponding force vector. Because of the assumption of static (instantaneous or motionless) equilibrium attained between each MC input force and its elicited reaction forces (corresponding to BF and either JF-W or JF-B, depending on side), a static correction factor (SCF) is introduced as an additional linear coefficient for each MC’s BF and JF to ensure static “force-equilibrium” with their input muscular force. This correction is similar to the “linear correction factor” used by Davis et al. (2010) to ensure that the integrated input stresses distributed over each muscular attachment area add up to the measured total muscular input force.
In addition to these MC forces, four manually-placed landmarks corresponding to the WS dentary-squamosal joint center of motion (WJ; Fig. 3B: point 5), BS dentary-squamosal joint center of motion (BJ), a point demarcating the mesial-most point of the working-side postcanine tooth-row (PM; Fig. 3B: point 1), and a point demarcating the distal-most point of the working-side postcanine tooth-row (PD; Fig. 3B: point 2), were added for each specimen as small icosphere objects on the CG hemimandible surfaces in Blender (using the 3D cursor tool). Both WJ and BJ were placed on an approximation of the caudal-most point of the articular surface of the mandibular condyle (condylare), as this point represents the assumed center of motion for the mandible in prior biomechanical studies of mandibular function such as Hartstone-Rose et al. (2012). The landmarks demarcating PM and PD were placed on the dorsal surface of the working-side dentary bone in the CG position. These two points are used to define a single, straight line running along the TR, thereby allowing for BVs (bite vertices, that is vertices comprising the lower working-side postcanine tooth crown mesh) to be projected to corresponding nearest positions within this line. The points PM and PD therefore define a variable ratio, here termed the mesiodistal location (MDL), which describes the ratio of the length of the line segment connecting the mesial point (PM) to a particular projection of a BV, to the total length of the line connecting PM to PD. Because of the need to compare postcanine vertex locations in a consistent way among specimens, the variable MDL (used as the abscissa in Figs. 5C, 6C, 8, 9) must take values ranging between 0.0–1.0 in all taxa analyzed, thereby necessitating that PM and PD be placed just mesial to the first postcanine tooth crown, and just distal to the last postcanine tooth crown, respectively.
The MC vectors (derived from highlighted MC attachment areas), the joint landmarks WJ and BJ, and the landmarks defining the mesial and distal ends of the working-side postcanine tooth-row (PM and PD) are all the user input required for the calculation of output forces from differential muscle recruitment scenarios (e.g., G1 vs. G2 activation) during mastication (viz. at CG; see left-hand side subplots in Fig. 7). For example, intermediate coordinates and vectors, such as the vector corresponding to the “occlusal-up” direction can be solved for by defining a line connecting the points of closest approach of the two skew lines representing the TR (between PM and PD) and the “bicondylar line” (between WJ and BJ). This occlusal-up vector for the closed gape position is also used to define the “direction of maxillary resistance” (DMR) for the postcanine tooth-row in the open gape (OG) position.
Open vs. closed gape analysis.—For the comparison of output forces between CG and OG mandibular positions (see right-hand side subplots in Fig. 7), additional user input to define the geometry of the lower mandible at OG is required. To generate this information, the meshes corresponding to both hemimandibles, the MC insertion areas, PM, and PD in the CG position were duplicated and re-positioned as a group (together) into a position approximating the “maximal bony gape” for each taxon (MBG; Fricano and Perry 2019). However, because WJ and BJ are assumed to be located on stationary axes of rotation for both adducting hemimandibles, the distal extent of the articular surface of the OG mandibular condyles were not translated to the anterior-most extent of the glenoid fossa (as they are for Fricano and Perry 2019; also see Crompton et al. 2006). The points WJ and BJ are therefore operationally assumed to not glide anteroposteriorly during the gape cycle. The position of OG for Diceros bicornis, Equus quagga, Erinaceus Europaeus, Sus scrofa, and Tupaia sp. were also estimated based on photographic evidence of living species, because of the exorbitant level of mandibular abduction permissible using only bony landmarks.
Once the duplicate mandibular meshes were placed into the OG position in Blender and all changes were applied, estimations of the MC force vectors and all intermediate variables (such as the “occlusal up vector”) are estimated for the OG position using the same methods as for the CG position described above. In order to generate the plots comparing OG and CG output forces between corresponding BVs, a short R script was used to identify matching vertices on the OG and CG meshes based on their MDL value (see SOM, Supplementary Online Material available at http://app.pan.pl/SOM/app67-Harper_etal_SOM.pdf).
The distances between each MC origin centroid and insertion centroid at CG are also compared to their corresponding wider distances at OG, allowing for the calculation of a stretch factor (SF; here estimated as the ratio of the distance between MC origin and insertion centroids at OG divided by this same distance at CG). These SFs (see Table 2) are used to decrement the strength of MC contraction at open gape according to the empirical formula for whole-muscle length-tension curves reported for the “masseter” of the miniature domestic pig (Anapol and Herring 1989). These length-tension curves show a characteristic offset between fascicle length at closed gape (with teeth in occlusion) and a somewhat longer optimum length representing the length of muscular extension corresponding with maximal whole-muscle tension (i.e., maximal MC force magnitude). The value of this offset shown for the masseter in Anapol and Herring (1989), is ~5% based on the distance between the gonial angle (equivalent to the angular process) and the central region of the zygomatic arch. However, because the categorization of MCs used in this report combines several of the discrete muscular bellies making up the composite “masseter” and other muscles analyzed by Anapol and Herring (1989), and because of our use of different distances to define SF in this report (between attachment centroids), the 5% value of the closed-maximal offset produces unrealistic multipliers for maximal MC force magnitude. This is likely a product of the shorter distances between muscle attachment centroids for most MCs (where, for instance on concave surfaces, the centroid is located hovering some distance off of the surface of its bony attachment). To decrease this methodological mismatch, the method we consistently apply for all taxa and MCs is to decrement the magnitude of MC force at OG following the “descending limb” of the isometric length-tension relationship of the masseter reported by Anapol and Herring (1989), assuming a 30% offset between optimal length and length at closed gape for all taxa. The optimal magnitude of MC contraction is also assumed to be negligibly different from the force of MC contraction at the closed gape position (described above), which is equivalent to assuming an approximately horizontal “ascending limb” of the log length-tension curve for each MC. Additionally, the component of muscle tension contributed by passive tension generated from the parallel elasticity of the apomorphic intramuscular tendinous sheets in the pig masseter is here assumed to be negligible for S. scrofa and all other sampled taxa as well.
Table 2. Estimated relative force contributions and stretch factors measured in sampled taxa. Abbreviations: B, balancing-side; DM, deep masseter; MP, medial pterygoid; PT, posterior temporalis; R, relative contribution to total jaw adductor attachment area; SF, stretch factor; SM, superficial masseter; W, working-side.
| |
Canis familiaris |
Crocuta crocuta |
Diceros bicornis |
Didelphis marsupialis |
Equus |
Erinaceus eruopaeus |
Peligrotherium tropicalis |
Procyon |
Puma |
Sus |
Tayassu |
Tupaia sp. |
Ursus |
|
R SM |
0.11 |
0.1 |
0.32 |
0.19 |
0.29 |
0.16 |
0.15 |
0.12 |
0.1 |
0.28 |
0.16 |
0.17 |
0.12 |
|
R DM |
0.18 |
0.17 |
0.21 |
0.22 |
0.23 |
0.2 |
0.19 |
0.18 |
0.21 |
0.23 |
0.2 |
0.21 |
0.18 |
|
R MP |
0.1 |
0.06 |
0.11 |
0.05 |
0.25 |
0.09 |
0.1 |
0.07 |
0.06 |
0.22 |
0.19 |
0.09 |
0.07 |
|
R PT |
0.6 |
0.68 |
0.37 |
0.53 |
0.23 |
0.55 |
0.55 |
0.62 |
0.64 |
0.27 |
0.45 |
0.54 |
0.63 |
|
SF SM-W |
1.23 |
1.14 |
1.24 |
1.41 |
1.17 |
1.34 |
1.27 |
1.18 |
1.15 |
1.32 |
1.26 |
1.31 |
1.2 |
|
SF SM-B |
1.2 |
1.18 |
1.25 |
1.44 |
1.16 |
1.38 |
1.23 |
1.21 |
1.23 |
1.3 |
1.28 |
1.24 |
1.2 |
|
SF DM-W |
1.32 |
1.3 |
1.13 |
1.87 |
1.27 |
1.45 |
1.57 |
1.38 |
1.28 |
1.38 |
1.33 |
1.53 |
1.47 |
|
SF DM-B |
1.3 |
1.32 |
1.17 |
1.86 |
1.29 |
1.52 |
1.38 |
1.37 |
1.37 |
1.35 |
1.32 |
1.39 |
1.47 |
|
SF MP-W |
1.2 |
1.12 |
1.19 |
1.23 |
1.13 |
1.22 |
1.29 |
1.12 |
1.18 |
1.2 |
1.1 |
1.26 |
1.13 |
|
SF MP-B |
1.19 |
1.14 |
1.17 |
1.28 |
1.12 |
1.21 |
1.39 |
1.13 |
1.14 |
1.22 |
1.1 |
1.28 |
1.13 |
|
SF PT-W |
1.29 |
1.28 |
1.23 |
1.24 |
1.09 |
1.2 |
1.17 |
1.26 |
1.22 |
1.14 |
1.17 |
1.15 |
1.31 |
|
SF PT-B |
1.28 |
1.29 |
1.23 |
1.23 |
1.07 |
1.21 |
1.22 |
1.24 |
1.2 |
1.12 |
1.16 |
1.14 |
1.33 |
Significance tests.—The above analyses, implemented as a sequentially executed group of scripts for the Blender-Python API, outputs estimates of the relative magnitude of BF, orthal BF, JF-W, and JF-B, generated under G1 vs. G2 muscle recruitment scenarios, and (as a separate analysis) at CG vs. OG (Figs. 5B, 6B, and 7). Plots of these relative magnitudes as a function of MDL are shown in Figs. 5C, 6C for P. tropicalis, and Figs. 8, 9 for the N = 12 comparative therians. These results (described below) are clearly not normally distributed, and significance tests for differences in BF characteristics cannot be based on the assumption of their being distributed normally. The pairwise Monte Carlo randomization tests implemented here are based on testing for significant differences in the mean and variance of per-vertex G1 minus G2 BF and orthal BF relative magnitudes; and the mean and variance of per-vertex CG minus OG BF and orthal BF (parallel to the DMR) relative magnitudes. Because of the many thousands of relative magnitude estimates measured in a lower tooth-row mesh, there is a strong tendency for these parameters to present significant differences in pairwise tests between taxa driven solely by the large sample size (not effect size). The large number of measured vertices per taxon also would demand exorbitant computational resources to perform a large number of randomized relabelings for all measured vertices in all taxa studied. The methods used here perform 1000 randomized relabelings for each pairwise significance test, which randomly subsample 100 vertices from each of the lower molar meshes for each permuted relabeling. The observed value for the difference in mean G1 minus G2 magnitudes, and CG minus OG magnitudes, were then pooled and compared with this randomized sample using a two-tailed (the rejection region includes 2.5% of permutations greater than |x| and less than -|x|) significance criterion. For the variance of per-vertex G1 minus G2 magnitudes, and CG minus OG magnitudes, the F parameter (a sample size adjusted ratio of variances) was calculated for each pair of taxa, and this in turn was tested with a 2-tailed criterion for the F-distribution: the rejection region included 2.5% of permutations greater than max(x, 1/x) and 2.5% less than min(x, 1/x). The results of these pairwise significance tests are tabulated in the final section of the supplementary information document, and are summarized graphically as the network plots in Fig. 10. In these plots, lines connect statistically indifferentiable taxa, with empirical p >0.05.
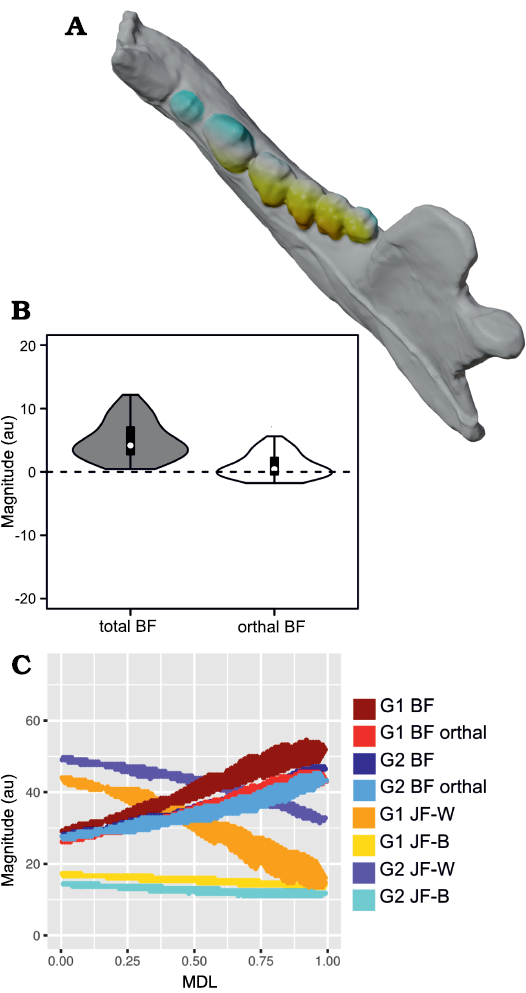
Fig. 5. Results of Group 1 (G1) minus Group 2 (G2) analysis of orthal bite force (BF) for Peligrotherium tropicalis Bonaparte, Van Valen, and Kramarz, 1993. A. Lower left working-side hemimandible of P. tropicalis with postcanine crowns colorized by relative G1 vs. G2 advantage (yellow shows areas where G1 produces higher orthal BF, while bluer colors correspond to higher G2 BF values; white areas are where G1 and G2 forces are sub-equal). B. Violin boxplot showing distribution of total GP1 minus GP2 BF and its orthal component marginal over all locations in the postcanine tooth-row (TR). C. 2D histogram plot showing distribution of estimated bifulcral force magnitudes for G1 and G2 muscle recruitment regimes, as a function of mesiodistal location (MDL). JF-W/B, working-/balancing-side joint force.
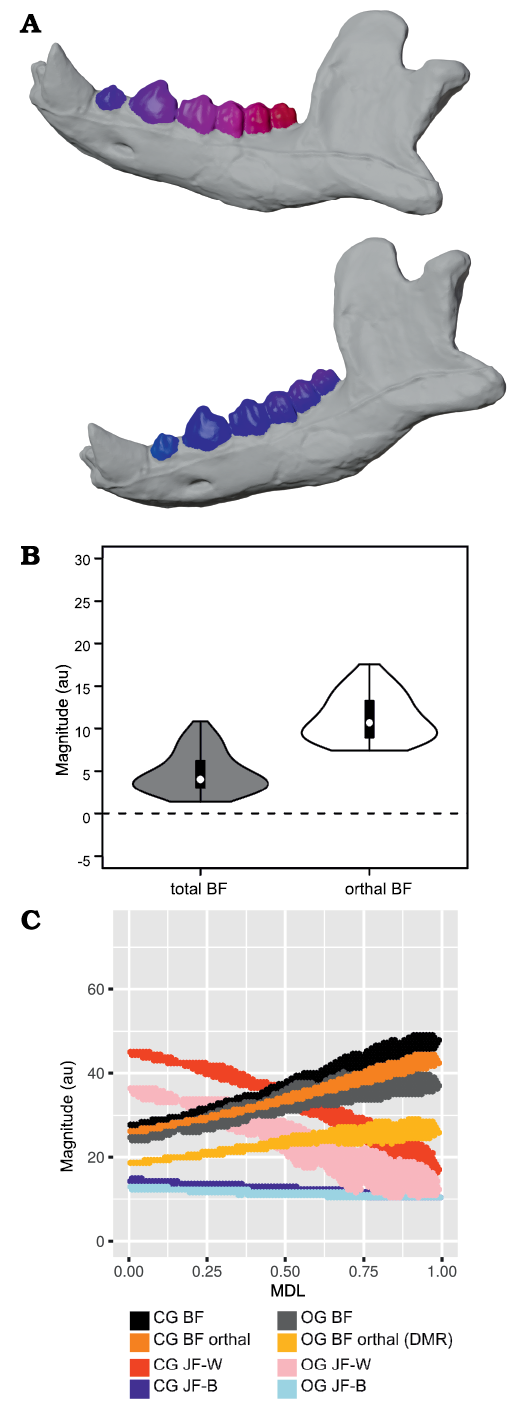
Fig. 6. Results of closed gape minus open gape analysis of orthal bite force (BF) for Peligrotherium tropicalis Bonaparte, Van Valen, and Kramarz, 1993. A. Lower left working-side hemimandible of P. tropicalis shown in closed gape (CG) and open gape (OG) position, postcanine crown surfaces are colorized by relative orthal BF (warmer colors represent higher relative orthal BF, and correspond among the taxa seen in Fig. 12). B. Violin boxplot showing distribution of total CG minus OG BF and its orthal component marginal over all locations in the woking-side postcanine tooth-row. C. 2D histogram plot showing distribution of estimated bifulcral force magnitudes for CG and OG, as a function of mesiodistal location (MDL). JF-W/B, working-/balancing-side joint force.
Results
From Fig. 7 it is apparent that there is considerable within-tooth-row variation in BF and orthal BF. Figures 5C, 6C, 8, and 9 further show that BF and the orthal component of BF (that is, directed toward the DMR) show a near-monotonic increase for all leverage scenarios, while JF-W and JF-B similarly show a near-monotonic decrease running distally along the TR in all cases (that is running from MDL values of 0.0 to 1.0 along the x-axis). The sensitivity of these output force magnitudes to the precise location of a BV within a particular crown surface also seems to vary among taxa, with Peligrotherium tropicalis, Tupaia sp., the suoids, Crocuta crocuta, and the hypocarnivores showing much wider within-tooth-crown variability than the other sampled taxa. Tayassu pecari and Tupaia sp. in particular (Figs. 7, 8, and 9) seem to show the most variability in output force magnitudes both marginally and especially at distal MDL values.
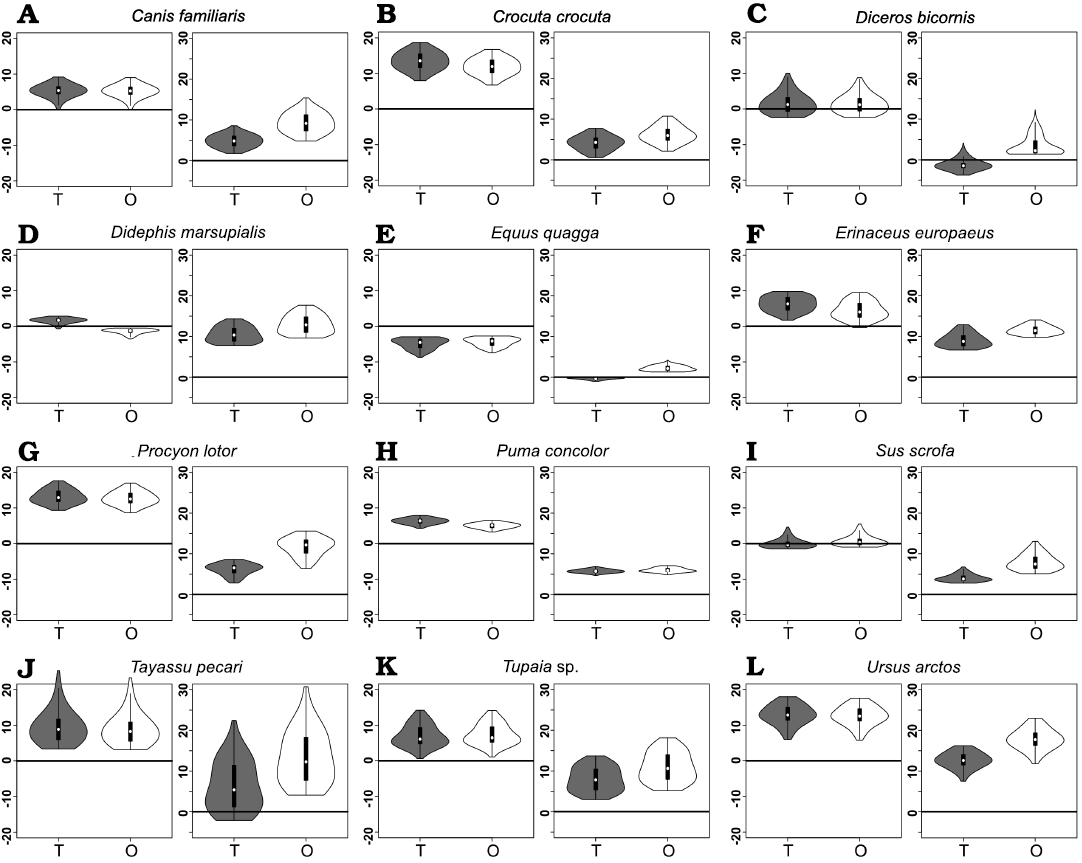
Fig. 7. Violin boxplots showing distribution of Group 1 minus Group 2 values (on left) and closed gape minus open gape values (on right) for N = 12 representative extant therians. A. Canis familiaris (domestic dog). B. Crocuta crocuta (spotted hyaena). C. Diceros bicornis (black rhino). D. Didephis marsupialis (opossum). E. Equus quagga (quagga). F. Erinaceus europaeus (European hedgehog). G. Procyon lotor (racoon). H. Puma concolor (mountain lion). I. Sus scrofa (domestic pig). J. Tayassu pecari (white-lipped peccary). K. Tupaia sp. (treeshrew). L. Ursus arctos (brown bear). Abbreviations: T, total bite force; O, orthal bite force. Vertical axes represent magnitude values in au.
Group 1 vs. Group 2 analysis.—Only Didelphis marsupialis shows broadly subequal BF values for both G1 and G2 muscles across the entire length of the TR. However, Peligrotherium tropicalis, Sus scrofa, and Diceros bicornis show non-parallel G1 and G2 BF distributions along the TR which coalesce or intersect mesially (Figs. 5C, 8C, I) . Only the derived obligatory grazer Equus shows BF values for G2 muscles markedly higher than G1 muscles everywhere. When just the orthal component of G1 or G2 bite force is considered, only P. tropicalis, Didephis marsupialis, Erinaceus eruopaeus, and Equus quagga show a marked difference in magnitude distribution compared with total BF magnitude (Figs. 5C, 8D–F). This a product of the naturally very orthal direction of G1 and G2 postcanine bite forces in Tupaia sp. and the other carnivores and ungulates.
The orthal component of BF in Didephis marsupialis is everywhere higher for G2 muscles than G1. This can be explained as a reflection of the emphasis that opossums place on P2 during mastication and the reduction of ingested material, which require particles to be compressed in the orthal direction against the upper dentition (Fig. 8D; Crompton and Hiiemae 1970). As with total BF, Equus quagga also shows much higher orthal G2 BF magnitudes compared with G1 (Fig. 8E). The pattern of orthal BF distribution seen in P. tropicalis, S. scrofa, Tayassu pecari, and Diceros bicornis is less parallel than in the other sampled taxa and converges mesially, much as with total BF. For Tayassu pecari this geometric arrangement of forces causes the relative magnitude of G1 to G2 orthal force to increase distally and labially in the molar region. However, even at the mesial most extremity of the TR, orthal G2 magnitudes are not appreciably greater than G1 (Fig. 8J). This relative pattern is accentuated in P. tropicalis, Diceros bicornis, and S. scrofa, where the trends of G1 and G2 orthal BF cross in the distal premolar region (Figs. 5C, 8C, I). This causes orthal G2 forces to be markedly greater mesially in the TR and also lingually within the molar row. Importantly, within the molars, the regions with greater G2 relative to G1 forces are located lingually, within the trigonid (and talonid for S. scrofa and Diceros bicornis) of each molar crown. Areas on the molar surface with appreciably greater G1 orthal BF correspond to the exodaenodont lobes of P. tropicalis (labial regions of the molar crown which lack occlusal contact with the upper dentition; Fig. 5A). Of the taxa sampled for this report, P. tropicalis, S. scrofa, and Diceros bicornis are unique in showing a switch from greater G1 to greater G2 orthal forces within the lower postcanine surface. All other taxa can be fairly cleanly separated into those with consistently greater orthal G1 to G2 BFs (Canis familiaris, Crocuta crocuta, Erinaceus europaeus, Procyon lotor, Puma concolor, Tayassu pecari, Tupaia sp., and U. arctos; Fig. 8A, B, F–H, J–L) vs. those with consistently greater orthal G2 relative to G1 forces (Didelphis marsupialis and Equus quagga; and only Equus quagga shows this relationship with total BF as well; Fig. 8D, E). As opposed to Didephis marsupialis (where relative orthal G2 advantage remains approximately constant) and Equus (where the value of orthal G1 BF minus orthal G2 BF becomes more negative distally), the pattern of relative G2 advantage in P. tropicalis, S. scrofa, and Diceros bicornis follows a lingually directed gradient.
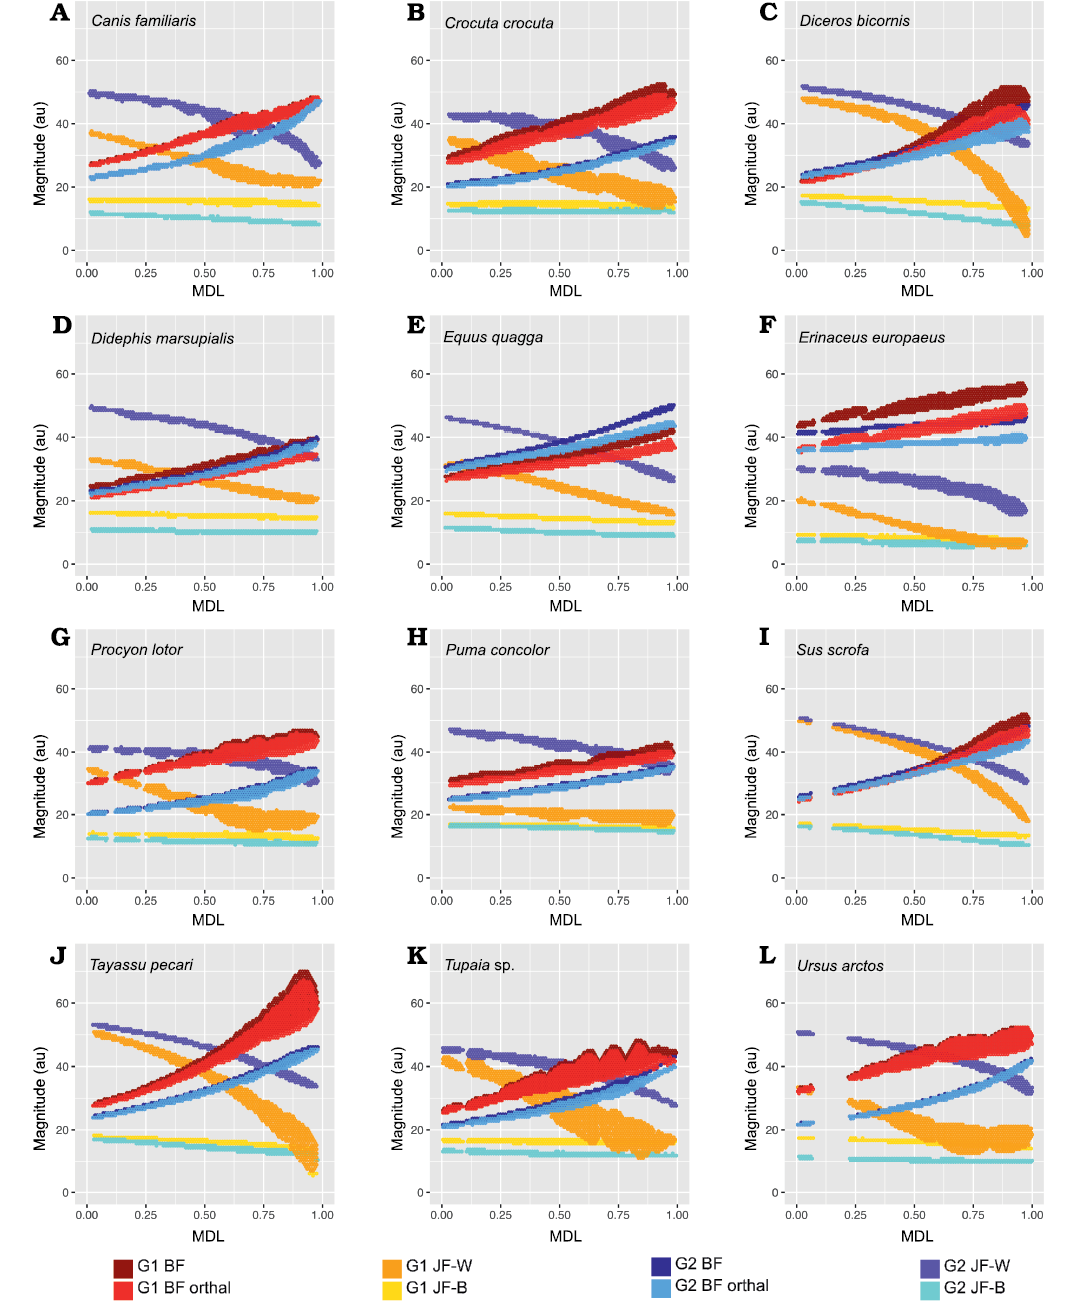
Fig. 8. 2D histograms showing distribution of estimated force magnitudes for Group 1 (G1) and Group 2 (G2) muscle recruitment scenarios (on ordinate), as a function of mesiodistal location (MDL; on abscissa). A. Canis familiaris. B. Crocuta crocuta. C. Diceros bicornis. D. Didephis marsupialis. E. Equus quagga. F. Erinaceus europaeus. G. Procyon lotor. H. Puma concolor. I. Sus scrofa. J. Tayassu pecari. K. Tupaia sp. L. Ursus arctos. Abbreviations: BF, bite force; JF-W/B, working-/balancing-side joint force.
The randomization tests for pairwise differences in mean TR G1–G2 values (see section “Group 1 minus Group 2 orthal BF pairwise test results” in the SOM) differentiate the sampled taxa into broad feeding categories, with the carnivorans U. arctos, Crocuta crocuta, and Procyon lotor having the highest G1–G2 orthal BF magnitudes (G1–G2 orthal BF values ~12 au). This is a product of the much greater orthal BF values under G1 muscle recruitment compared with G2 muscle recruitment scenarios. At the opposite extreme is Equus quagga, which shows the highest orthal BF magnitudes under G2 muscle recruitment (mean G1–G2 orthal BF is ~-4.4 au). The fossil P. tropicalis shows greater similarity to Equus in that its TR average G1–G2 orthal BF value is 0.95, and therefore closer in value to Equus quagga (and statistically indifferentiable from S. scrofa and Diceros bicornis) even though having a positive mean G1–G2 orthal BF value.
The pairwise randomization tests of standardized variance ratios (F-values) find fewer significant differences between taxa than the mean difference tests, the most salient result from these tests being the much greater TR standard deviation of G1–G2 orthal BF values in Tayassu pecari relative to every other sampled taxon (SD = 4.04). At the other extreme, both Didephis marsupialis and Puma concolor show significantly lower intra-tooth-row standard deviations in G1–G2 orthal BF than the remaining taxa (SD ~0.7 au). The interpretation of these tests is discussed further below.
Open vs. closed gape analysis.—In Crocuta crocuta, Diceros bicornis, Sus scrofa, Equus quagga, and Peligrotherium tropicalis, total BF is broadly similar between CG and OG throughout the whole length of the TR (Figs. 6C, 9B, C, E, I). It is also noteworthy that the magnitudes of CG and OG BF also converge mesially within the tooth-row of Tayassu pecari (Fig. 9J), as they approach the location of its enlarged vertical canine. In the case of Diceros bicornis, S. scrofa, Equus quagga, and Tayassu pecari, the similarity of CG and OG BF is likely a product of the extremely narrow maximal gape attainable by these taxa (in some locations even eliciting greater BF at OG than at CG; Fig. 7C, E, I, J). However, in the case of the durophagous Crocuta crocuta, this preservation of high-force at high gape should be considered a major geometrical adaptation. Whether these results might also be taken as evidence of a similarly durophagous diet in P. tropicalis could therefore be informed by the orthal component of its OG bite force magnitudes (Fig. 6).
When only the orthal component of BF (parallel to the DMR) is considered across gapes, several taxa show much greater magnitudes of orthal BF at CG compared to OG. From the violin plots in Fig. 7 it is apparent that no taxon has higher orthal BF at OG than CG, but several of the taxa with high OG bite forces lose a large proportion of that magnitude when only its orthal component is considered. This is especially true of S. scrofa and P. tropicalis (Figs. 9I, 6B) which show an average drop of ~5.1 au and 9.4 au of bite force magnitude, respectively (compared to Crocuta with only a 3.2 au decrease; Fig. 9B).
The magnitudes of JF-W are distinctly higher for CG compared with OG for most of the length of the TR in all taxa except Erinaceus eruopaeus (Fig. 9; in several others OG JF-W exceeds CG JF-W only far distally). The CG and OG values of JF-B are low and broadly similar for all taxa.
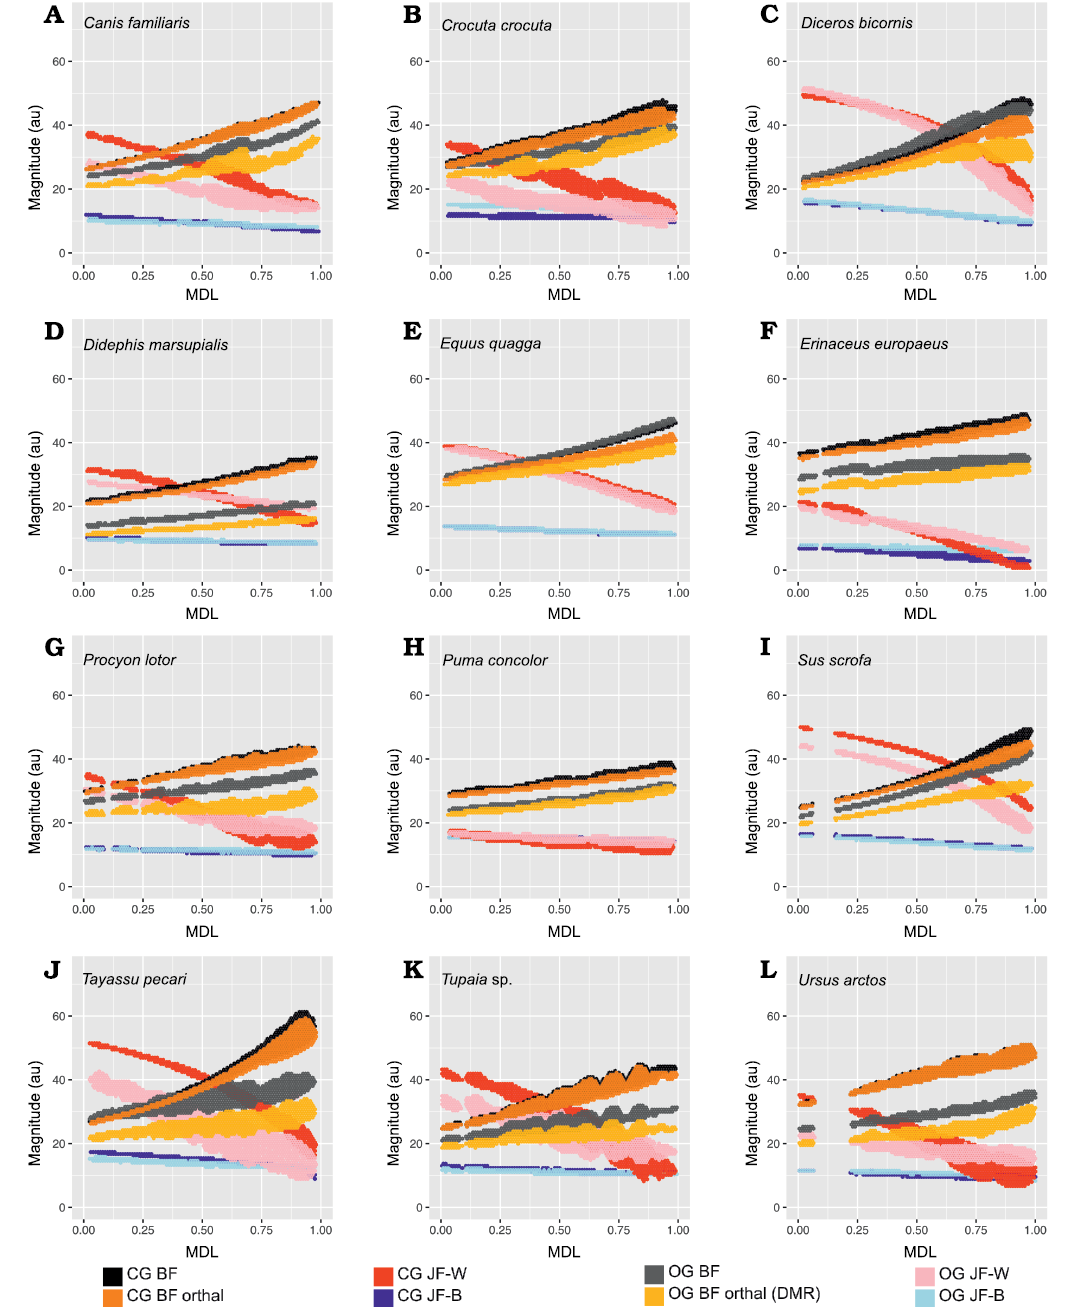
Fig. 9. 2D histograms showing distribution of estimated force magnitudes for closed gape (CG) and open gape (OG) mandible positions (on ordinate), as a function of mesiodistal location (MDL; on abscissa). A. Canis familiaris. B. Crocuta crocuta. C. Diceros bicornis. D. Didephis marsupialis. E. Equus quagga. F. Erinaceus europaeus. G. Procyon lotor. H. Puma concolor. I. Sus scrofa. J. Tayassu pecari. K. Tupaia sp. L. Ursus arctos. Abbreviations: BF, bite force; JF-W/B, working-/balancing-side joint force.
The randomization tests for pairwise differences in mean TR orthal CG-OG values (see section “Open minus closed gape orthal BF pairwise test results” in the SOM) show most taxa being significantly different from all others. At one extreme, Ursus shows the least ability to maintain high orthal forces at high gape (Fig. 9L), while Crocuta crocuta and the perissodactyls listed above show the greatest amount of OG orthal BF preservation (Fig. 9B, C, E). The pairwise randomization tests of standardized variance ratios (F-values) of CG-OG orthal BF values find much fewer significant differences, and as with the G1–G2 variance randomization tests Tayassu pecari shows a much higher variance of CG-OG values compared with the other sampled taxa (Figs. 7J, 9J). The conspicuously larger variance in estimated mandibular leverage parameters for Tayassu pecari, compared with all other sampled taxa, is a reflection of its wide range (Fig. 7J) and steep mesiodistal gradient (Fig. 9J) of measured BF and orthal BF at CG. The distributions of these BF estimates are in turn a consequence of the unique combination of mandibular characteristics seen only in Tayassu pecari in our sample. These unique characteristics are a result of combining (i) a very mesiodistally elongate jaw, with (ii) a mandibular condyle positioned nearly in-line with the dorsoventral height of the postcanine tooth-row.
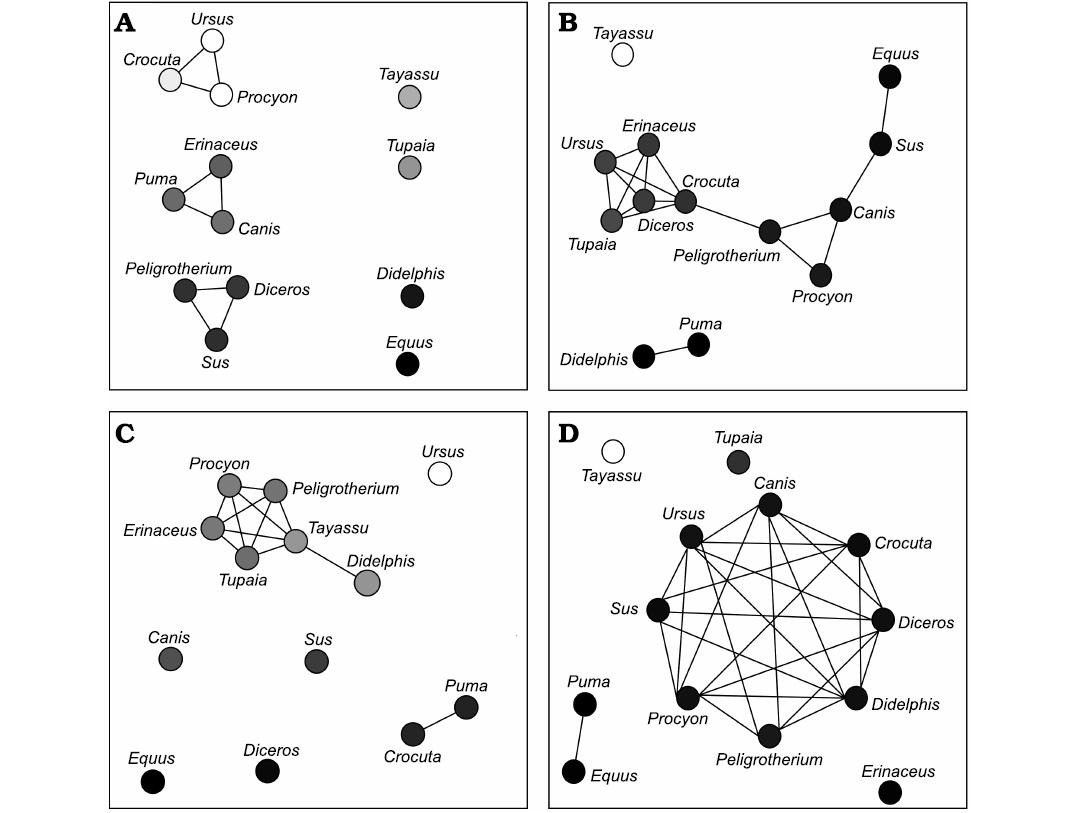
Fig. 10. Connectivity graphs summarizing the results of pairwise randomization tests performed on the per-vertex values of orthal bite force (BF) differences. Lines connect taxa that are not found to be significantly different, and gray-scale value of individual nodes are proportional to the value of the parameter tested (e.g., dark tones are lower in value, and higher values are closer to white). A. Graph summarizing pairwise significance tests of mean Group 1 (G1) minus Group 2 (G2) orthal BF. B. Graph summarizing pairwise significance tests of F-value (variance ratio) of G1 minus G2 orthal BF. C. Graph summarizing pairwise significance tests of mean closed gape minus open gape orthal BF. D. Graph summarizing pairwise significance tests of F-value (variance ratio) of closed gape minus open gape orthal BF.
Discussion
With the methods and comparative samples described above, several significant and autecologically meaningful patterns are apparent concerning the use of G1 vs. G2 muscles and CG vs. OG behaviors in Peligrotherium tropicalis. While the tables in the supplementary information document present these results explicitly, it is helpful to visualize the 676 pairwise randomization tests (169 each for the variables G1 minus G2 and CG minus OG, mean and variance, respectively) in aggregate using network graphics (generated using the igraph package for R; Csardi and Nepusz 2006). Figure 10 displays the patterning of these results among our sampled taxa by placing a line connecting taxa that are not found to be significantly different in the parameter tested (p >0.05). Conversely, taxa that are not directly connected by a line are found to be significantly different. As can be seen in Fig. 10A, the patterning of mean G1 minus G2 orthal BF magnitudes places P. tropicalis in a statistically mutually indistinguishable cluster with the ungulates Diceros bicornis and S. scrofa, based on their relatively high G2 advantage. Similarly, mean G1 minus G2 orthal BF also clusters the carnivorans Crocuta crocuta, U. arctos, and Procyon lotor, in a “high G1 advantage” group, and Puma, Canis, and Erinaceus based on their intermediate G1 minus G2 values. While it is surprising that the hypercarnivore Puma concolor has not been placed in the highest G1 advantage group, these clusters of taxa with generally similar feeding strategies provide some confidence that the placement of P. tropicalis with the omnivore S. scrofa and the obligate browser Diceros indicates some level of herbivory in its feeding strategy. It is important to realize that this inference is not based on P. tropicalis grouping into a homogeneous, or cohesive, feeding category with these two ungulates; and inferences should only be based on its being significantly different from all other sampled taxa in mean G1 minus G2 orthal BF. For example, P. tropicalis has a ratio of G1 to G2 advantage that is definitively dissimilar to the plesiomorphic therians Didephis marsupialis, Erinaceus europaeus, and Tupaia sp., the hypo-and-hypercarnivorous carnivorans, and the derived ungulates Equus quagga and Tayassu pecari. As such, P. tropicalis, S. scrofa, and Diceros bicornis may (and actually do) have unique masticatory behaviors that are effected by the subtle geometrical differences in their mechanical feeding apparatuses, but are together statistically differentiated from all other mammals sampled. Figure 11 provides a graphical comparison of the distribution of relative G1 minus G2 orthal BF among three of the sampled therians.
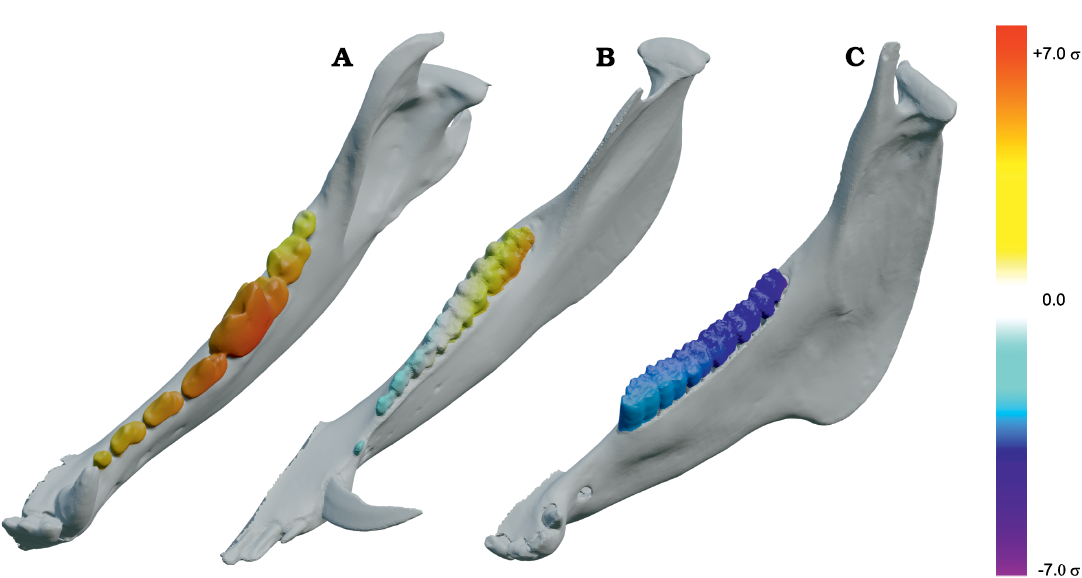
Fig. 11. Comparison of orthal Group 1 (G1) vs. orthal Group 2 (G2) bite force (BF) across the lower postcanine tooth-row. Warmer colors correspond to higher G1 muscle advantage, and cooler colors correspond to higher G2 advantage. A. Canis familiaris Linnaeus, 1758. B. Sus scrofa Linnaeus, 1758. C. Equus quagga Boddaert, 1785. Note that Sus scrofa matches Peligrotherium tropicalis most closely, in having greater G1 advantage disto-buccally and greater G2 advantage mesio-lingually. Color scale is based on range of G1 minus G2 orthal BF magnitudes scaled by the value of single sample (within-taxon) standard deviation in this value.
These results therefore demonstrate that mandibular geometry can be added to the list of similarities, such as size (large), and gestalt molar condition (bunodont) shared between P. tropicalis and many therian omnivores and herbivores. Unlike body mass (which is ambiguous) and dental form and formula (associated with the statistics of dietary material properties; Kay and Hiiemae 1974; Lucas 2004), the convergent emphasis on “Group 2” geometry in the feeding apparatus of P. tropicalis, S. scrofa, and Diceros bicornis, suggests that the “grinding forces” (sensu Kay and Hieemae 1974) transmitted by the dentition and driven by the muscles of mastication in these forms, are in turn coordinated by fundamentally similar motor programs. The dynamic behaviors effecting mastication in these herbivores-omnivores are therefore plausibly more similar to each other than they would be to an ancestral therian mammal or even plesiomorphic extant therians such as Didelphis marsupialis, Erinaceus europaeus, or Tupaia sp.
It is also important to note that the results of this analysis do not support a single cohesive feeding geometry of “primitive therians”, clustering Didelphis marsupialis, Erinaceus europaeus, and Tupaia sp. This is opposite to what would be expected if the earliest, or least derived, therians and earlier mammaliaforms were characterized by a single stereotyped mode of branchiomotor muscle recruitment during mastication (see Gill et al. 2014 for further biomechanical evidence for the early feeding diversity of mammaliaforms generally). The clusters of taxa shown in Fig. 10A therefore do not reflect or imply phylogenetic patterns of jaw conformation.
The above considerations answer the question of whether the clustering of P. tropicalis, S. scrofa, and Diceros bicornis in terms of G1 and G2 orthal BF could represent some shared ancestral motor pattern; as such a synapomorphic motor pattern would presumably have to include the more plesiomorphic therians sampled as well. The geometric evidence presented here strongly suggests a geometrical convergence of the feeding apparatus between P. tropicalis (Fig. 5A), S. scrofa (Fig. 11B), and Diceros bicornis (Fig. 4B), as opposed to a retained synapomorphy inherited from a likely Jurassic common ancestor. However, the fact that the feeding apparatus in Peligrotherium morphologically associates more closely to some large therian herbivores/omnivores than all the sampled therians associate among themselves supports several prior hypotheses for the evolution of masticatory capacities of mammals generally.
The electromyographic and biomechanical analyses reported by Crompton and Hylander (1986) have suggested that, commencing with the development of a dentary-squamosal jaw articulation, at least the structural capacity for unilateral mastication could have been feasible among advanced cynodonts. Whether this capacity was realized by mammaliaforms generally, or was restricted in distribution only to therians, or convergently found in more inclusive mammaliaform sub-clades showing a detachment of Meckel’s element and postdentary elements from the dentary, is still unresolved (Meng et al. 2003). Cladotheria is one such clade of Jurassic and later mammaliaforms which includes P. tropicalis and extant therians, and has been hypothesized to show evidence of extensive medio-lateral excursions during mastication (Grossnickle 2017). Features such as wider upper molars relative to corresponding lowers, the presence (or possibly reappearance) of a true angular process and the widespread (but homoplastic) loss of Meckel’s groove within Cladotheria have been interpreted as indicating a “primitive tribosphenic” mode of unilateral mastication effected by a stereotyped asymmetrical regime of chewing muscle recruitment (Grossnickle 2020). While the evidence presented here does not associate the feeding geometry of Peligrotherium with any of the plesiomorphic therians listed above, the fact that P. tropicalis does show a high level of “Group 2 advantage” does lend support to the hypothesis that the common ancestor of Peligrotherium and therians would have shown at least an incipient form of rhythmic chewing with a power stroke subdivided into P1 and P2 vertical kinematic phases. This incipient pattern of cladotherian mastication was likely then exapted and exaggerated independently in the meridiolestidan ancestors of Peligrotherium, the “dichobunoid” artiodactyl ancestors of Sus, and the stem-perissodactylan ancestors of Diceros (Gould and Vrba 1982). This convergence is also seen in the mediolateral gradient of increasing G2 advantage lingually (Figs. 5C, 11B), where grinding motions would be more emphasized. Conversely, the labial portions of the postcanine tooth-row in these three taxa are where G1 muscles have a greater advantage, suggesting that times of labial molar-crown food contact, with either the exodaenodont lobes (in P. tropicalis) or the labial upper molar ectolophs (in Diceros), occur during P1 of the masticatory power stroke.
The significance tests summarized by the connectivity graphs for mean CG minus OG orthal bite force (Fig. 10C) and for the variance of both G1 minus G2 and CG minus OG orthal bite force values (Fig. 10B, D) are more difficult to interpret ecologically. As mentioned above, the tested parameter “CG minus OG orthal bite force magnitude” conflates taxa that are genuinely adapted for wide-gape behaviors (most obviously Crocuta bicornis) with strongly herbivorous taxa that, because of their very limited maximal gapes, do not show a large loss of orthal bite force at their widest gapes. We have not attempted to resolve this issue here, because many of the obvious solutions to this problem (such as dividing the CG minus OG orthal bite force magnitude value by some standard measurement of gape-distance or gape-angle) either are extremely sensitive to how size and linear distances are standardized among sampled taxa, or are arbitrary and difficult to apply across a large range of cranial morphologies, or both. The mean CG minus OG orthal BF significance tests do however suggest that P. tropicalis does not fit in in either of these conflated feeding categories (wide-gape carnivore, limited-gape herbivore), and place Peligrotherium among a large cluster of the more plesiomorphic and/or generalized extant taxa sampled (Figs. 10C, 12). Similarly, the significance tests for differences in F-value (variance) for both G1 minus G2 and CG minus OG values place P. tropicalis among large and ecologically heterogeneous clusters of extant taxa (Fig. 10B, D).
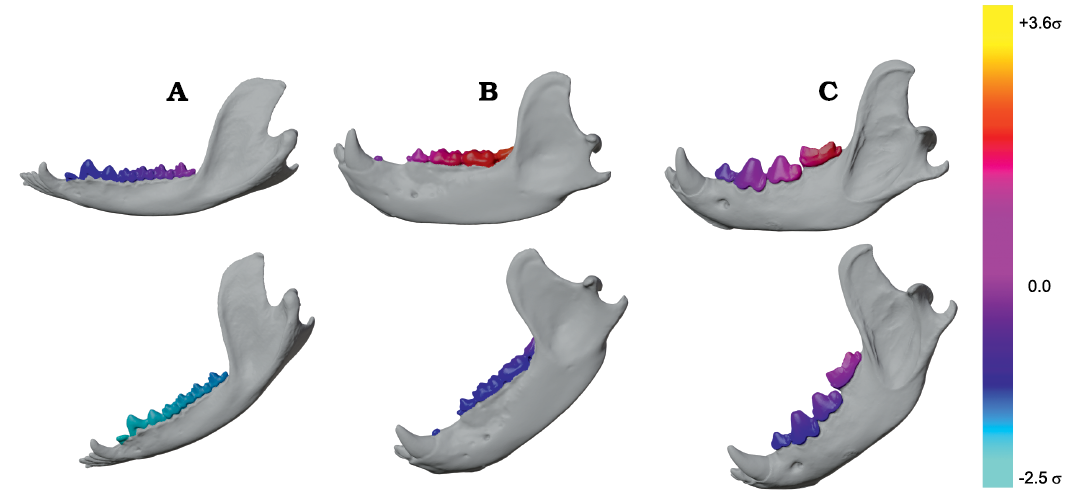
Fig. 12. Comparison of orthal bite force (BF) distribution across lower tooth-row at closed gape (CG) and open gape (OG). A. Didelphis marsupialis Linnaeus, 1758, a generalized mammal showing relatively low orthal BF magnitudes at both CG and OG. B. Ursus arctos Linnaeus, 1758, which shows very little ability to preserve high orthal BF at high gape among the therians sampled, but has very high orthal BF at CG. C. Crocuta crocuta (Erxleben, 1777), a taxon capable of preserving a large amount of orthal BF at high gape, and showing similar orthal BF values at CG and OG. Color bar at right is scaled to units of the combined (across-taxa) sample standard deviation in estimated orthal bite force values (generated using all muscle categories, see text). Therefore, colors within the postcanine toothrow correspond to matching, size-scaled, orthal BF magnitudes across all sampled taxa (and in Peligrotherium tropicalis as seen in Fig. 6A).
Validation and criticism of the new method.—The paucity of reported correlations between average empirical bite forces (such as measured through in vivo bone-strain and pressure transducer experiments) and the maximal theoretical bite force estimates produced by biomechanical studies such as this one prevent us from making a definitive statement on whether our novel Blender method presents a more realistic model of mandibular function compared to earlier approaches (see Ellis et al. 2008 and Davis et al. 2010 for important correlative studies however). Despite this lack of empirical cross validation from these different approaches, our method’s explicit use of vectors in their natural three-dimensional context provides a unique, and previously unavailable, capacity to answer questions regarding the relative significance of the mediolateral positioning and orientation of muscular effort vectors. This potential is all the more important for investigations of the relatively understudied non-tribosphenic crown mammals, given the novel evolution of several translational and angular degrees of freedom derived in the early mammalian feeding apparatus (Grossnickle 2017, 2020; Bhullar et al. 2019; Jäger et al. 2020).
This analysis also requires a smaller number of mechanical assumptions regarding the generation and transmission of jaw adductor tension compared with similar approaches, and is likely robust to several of the major forms of un-measurable error inherent to these methods (see also Ellis et al. 2008). Typical operational assumptions required by recent jaw biomechanical analyses include: the equal and homogenous activation of both working and balancing-side muscles of mastication (Reed et al. 2016); a priori knowledge on the orientation of the axes of rotation of the adducting mandible (Perry et al. 2011; Reed et al. 2016; Grossnickle 2017); conjoint (identical) motion of both hemimandibles (Ellis et al. 2008; Reed et al. 2016); and the restriction of output bite vectors to the “occlusal-up” direction (Lautenschlager 2013; Reed et al. 2016). Perhaps more importantly, this method’s use of digitized meshes as a fundamental data type allows for the (condylar plane and bite plane) lever equation parameter “output lever arm length” to be modeled as a densely sampled independent variable. The capacity to compute output forces corresponding to all vertices within the lower tooth-row allows subtle contours within the general monotonic increase in BF and decrease in JF distally to be qualitatively and statistically contrasted between species (e.g., Figs. 8, 9). From these results it is apparent that the relationship between BF and JF-W/B estimates produced by our method generally agrees with the theoretical predictions of force distribution by Greaves (2012) in his treatment of the jaw as a statically-loaded two-dimensional lever (see Greaves 2012: fig. 1.5). Also matching these expectations, the magnitude of each muscle category’s input force elicits a subequal magnitude from the combined BF and JF (of the corresponding side). However, it is not known if these estimates of relative magnitude as a function of MDL would allow reasonably approximate estimates of cumulative BF and JF pressure by integrating areas under these empirical MDL-magnitude curves (see Greaves 2012).
The geometric similarity between P. tropicalis and two of the more omnivorous/herbivorous extant therians sampled here strongly implies a functional similarity in the muscular activation and leverage produced during mastication in these forms. Given the additional similarities in size and degree of bunodonty between Peligrotherium, Sus, and many Paleogene archaic ungulates, our results are unlikely to be the product of random error. However, as with any novel method the possibility of several forms of systematic errors in this protocol do have to be considered. Large systematic errors can be byproducts of overly simplistic model assumptions, and for this report, the major assumption is that all non-geometric aspects of jaw adductor myology correspond to a therian (and in particular a “generalized therian”) pattern.
For instance, the locations of muscle attachments for the superficial masseter, deep masseter, posterior temporalis, and medial pterygoid muscle categories in P. tropicalis are based on topological indicators influenced by our experience with extant therian mammals (especially Didelphis), which is tantamount to assuming that P. tropicalis had a distribution of masticatory muscles segregated into something approximating the major therian muscle groups. We feel that this is a reasonable assumption because of the previously stated similarity between Peligrotherium and many extant and Paleogene eutherian taxa (in which the inferred presence of the major temporalis, medial pterygoid, and masseter muscle groups are noncontroversial). This assumption would have to be reconsidered if future evidence supports a more monotreme-like (Griffiths 1978) or otherwise incomparable subdivision of the chewing musculature in Peligrotherium and other stem-therian mammals.
These operational assumptions also extend to all sampled extant taxa, because of the above-mentioned standardized muscle categorizations (posterior temporalis, medial pterygoid, superficial masseter, and deep masseter) and B-WR imposed on all taxa. Our necessity of modeling the masticatory apparatus using the simplest terms and most convenient definitions is a byproduct of prior research into the vertical kinematic phases of masticatory function being phrased in this way, and the lack of pertinent EMG and myological data availability for most extant mammalian species. Additionally, the taxa with the most complex tendinous subdivision of the masseter muscle mass (Equus quagga and S. scrofa; Turnbull 1970; Herring and Scapino 1973) also show greater similarity with P. tropicalis using our method. What effect the future incorporation of empirical information of the internal pinnation of these muscles would have on our similarity measures and significance tests is not known.
Conclusions
The above caveats being mentioned, the results summarized above still represent strong evidence for the Cretaceous–Paleogene adaptation of non-therian mammals in South America along similar trajectories to their therian contemporaries in the northern landmasses. Additionally, the new 3D generalization of the bifulcral model provides a widely applicable method for the estimation of masticatory forces that involves fewer physical constraints and operational assumptions than previously published approaches. We believe that this method will be particularly important for elucidating the functional consequences of the increasingly mediolateral orientations of muscular resultant vectors during the evolution of mammalian mastication.
Finally, while in the above discussion we have used the historically prevalent phrase “bite force” and similar terms, we recommend that future studies in masticatory biomechanics use more disciplined terminology in discussions of the mammalian postcanine dentition. In particular the behavioral distinction between “biting” and “chewing” (mastication) should be respected, and terms referencing “bite force” or “biting force” should be reserved solely for contact points within the canine and incisor tooth-row. Mastication, unlike biting, for the most part is a process which occurs unilaterally, within a specialized anatomical region (the postcanine tooth-row), and is produced by differing, time-dependent, patterns of muscular recruitment. In the future, terms like “occlusal force” or even “Group 2 occlusal force” will likely better reflect the actual phenomena being studied, and reduce confusion.
Acknowledgements
As with the other contributions in this series, we would like to sincerely thank Richard Cifelli (Oklahoma Museum of Natural History, Norman, USA) for his years of research on many South American and Mesozoic mammalian lineages (Cifelli 1985 being just one such example). So much of his work has proven foundational to our field that we would have a hard time finding parts of this report that are not influenced by it. We are also extremely grateful for the time and talent donated for this project by Amy Bishop (Lincoln Memorial University DeBusk College of Osteopathic Medicine, Knoxville, USA), who produced the detailed pen and ink reconstruction of Peligrotherium seen in Fig. 1A. TH would also like to thank the many vertebrate paleontologists/functional morphologists who have donated their time and attention to the conceptual/computational aspects of this project, especially Jonathan Perry (Johns Hopkins University, Baltimore, USA), Calum Ross (University of Chicago, USA), Brian Davis (University of Louisville, USA), Jillian Davis (West Virginia University, Morgantown, USA). Roger Benson and Roberto Portela Miguez (both Museum of Natural History, London, UK), Marco Ansón (Paleoart, Madrid, Spain), Joseph Frederickson (Weis Earth Science Museum, University of Wisconsin, Menasha, USA), and Matt Wedel (Western University of Health Sciences, Ponoma, USA) have also provided invaluable data and expertise in the production of this report. The Idaho Museum of Natural History provided access to these data; the collection of which was funded by Rick Carron Foundation.
Collecting, processing, and curating early mammals is a demanding task that would have not been possible without the help of numerous other colleagues and students. In particular we want to thank Leandro A. Canessa (Museo Egidio Feruglio, Trelew, Argentina) who found the best specimens of Peligrotherium tropicalis and Pablo Puerta (Museo Egidio Feruglio), Analia Forasiepi (Conicet CRICYT, Mendoza, Argentina), Agustín Martinelli (Conicet, Museo Argentino de Ciencias Naturales, Buenos Aires, Argentina), and Raul Gomez (Conicet, UBA, Buenos Aires, Argentina) for additional help in collecting the material, curating it and organizing the field work. We thank Eduardo Ruigómez and the rest of the staff at the Museo Egidio Feruglio as well, for their help with the collection over the years. Finally, we would like to sincerely thank Adam Hartstone-Rose (North Carolina State University, Raleigh, USA), David Grossnickle (University of Washington, Seattle, USA), and Olivier Lambert (Royal Belgian Institute of Natural Sciences, Brussels, Belgium) for their time and insight while reviewing this manuscript. Partial funding for this project was provided by the Department of Anatomical Sciences and Neurobiology, University of Louisville supported and PICT 2016 2682 GWR.
References
Anapol, F. and Herring, S.W. 1989. Length-tension relationships of masseter and digastric muscles of miniature swine during ontogeny. Journal of Experimental Biology 143: 1–16. Crossref
Andreis, R.R. 1977. Geología del área de Cañadón Hondo, Departamento Escalante, Provincia del Chubut, República Argentina. Obra del Centenario del Museo de La Plata 4: 77–102.
Averianov, A.O., Martin,
T., and Lopatin, A.V. 2013. A new phylogeny for basal Trechnotheria
and Cladotheria and affinities of South American endemic Late
Cretaceous mammals. Naturwissenschaften 100:
311–326. Crossref
Beddard, F.E. and Treves, F. 1889. On the anatomy of Rhinoceros sumatrensis. Proceedings of the Zoological Society of London 57: 7–25. Crossref
Bhullar, B.S., Manafzadeh, A.R., Miyamae, J.A, Hoffman E.A., Brainerd, E.L., Musinsky, C., and Crompton, A.W. 2019. Rolling of the jaw is essential for mammalian chewing and tribosphenic molar function. Nature 566: 528–532. Crossref
Boddaert, P. 1785. Elenchus Animalium, Vol. 1. 174 pp. Rotterodami Apud C.R. Hake, Rotterdam. [available online, https://doi.org/10.5962/bhl.title.40283] Crossref
Bonaparte, J.F. 1986. Sobre Mesungulatum houssayi y nuevo mamiferos Cretácicos de Patagonia, Argentina. Actas IV Congreso Argentino de Paleontología y Biostratigraphia 2: 48–61.
Bonaparte, J.F. 1990. New Late Cretaceous mammals from the Los Alamitos Formation, northern Patagonia. National Geographic Research 6: 63–83.
Bonaparte, J.F., Van Valen, L.M., and Kramarz, A. 1993. La fauna local de Punta Peligro, Paleoceno inferior, de la provincia del Chubut, Patagonia, Argentina. Evolutionary Monographs14: 1–61.
Boyer, D.M. 2008. Relief index of second mandibular molars is a correlate of diet among prosimian primates and other euarchontan mammals. Journal of Human Evolution 55: 1118–1137. Crossref
Bramble, D.M. 1978. Origin of the mammalian feeding complex: models and mechanisms. Paleobiology 4: 271–301. Crossref
Bramble, D.M. and Wake, D.B. 1985. Feeding mechanisms of lower tetrapods. In: M. Hilderbrand, D.M. Bramble, K.F. Liem, and D.B. Wake (eds.), Functional Vertebrate Morphology, 230–261. Harvard University Press, Cambridge. Crossref
Bressou, C. 1961. La myologie du tapir (Tapirus indicus L.). Mammalia 25: 358–400. Crossref
Buckland-Wright, J.C. 1969. Craniological observations on Hyaena and Crocuta (Mammalia). Journal of Zoology 159: 17–29. Crossref
Bunn, J.M., Boyer, D.M., Lipman, Y., St. Clair, E.M., Jernvall, J., and Daubechies, I. 2011. Comparing Dirichlet normal surface energy of tooth crowns, a new technique of molar shape quantification for dietary inference, with previous methods in isolation and in combination. American Journal of Physical Anthropology 145: 247–261. Crossref
Cifelli, R.L. 1985. South American ungulate evolution and extinction. In: F.G. Stehli and D. Webb (eds.) The Great American Biotic Interchange, 249–266. Springer, Boston. Crossref
Close, R.I. 1972. Dynamic properties of mammalian skeletal muscles. Physiological reviews 52: 129–197. Crossref
Crompton, A.W. 1995. Masticatory function in nonmammalian cynodonts and early mammals. In: J.J. Thomason (ed.), Functional Morphology in Vertebrate Paleontology, 55–75. Cambridge University Press, Cambridge.
Crompton, A.W. 2011. Masticatory motor programs in Australian herbivorous mammals: Diprotodontia. Integrative and Comparative Biology 51: 271–281. Crossref
Crompton, A.W. and Hiiemae, K. 1970. Molar occlusion and mandibular movements during occlusion in the American opossum, Didelphis marsupialis L. Zoological Journal of the Linnean Society 49: 21–47. Crossref
Crompton, A.W. and Hylander, W.L. 1986. Changes in mandibular function following the acquisition of a dentary-squamosal jaw articulation. In: N. Hotton, P.D. MacLean, J.J. Roth, and E.C. Roth (eds.), The Ecology and Biology of Mammal-like Reptiles, 263–282. Smithsonian Institution Press, Washington.
Crompton, A.W., Lieberman, D.E., and Aboelela, S. 2006. Tooth orientation during occlusion and the functional significance of condylar translation in primates and herbivores. In: M.T. Carrano, T.J. Gaudin, RW. Blob, and J.R. Wible (eds.), Amniote Paleobiology: Perspectives on the Evolution of Mammals, Birds, and Reptiles, 367–388. The University of Chicago Press, Chicago.
Crompton, A.W., Owerkowicz, T., and Skinner, J. 2010. Masticatory motor pattern in the koala (Phascolarctos cinereus): a comparison of jaw movements in marsupial and placental herbivores. Journal of Experimental Zoology Part A: Ecological Genetics and Physiology 313: 564–578. Crossref
Crompton, A.W., Wood, C.B., and Stern, D.N. 1994. Differential wear of enamel: A mechanism for maintaining sharp cutting edges. In: V.L. Bels, M. Chardon, and P. Vandewalle (eds.), Advances in Comparative and Environmental Physiology 18, 321–346. Springer-Verlag, Berlin. Crossref
Csardi, G. and Nepusz, T. 2006. The igraph software package for complex network research. Complex Systems 1695: 1–9.
Davis, D.D. 1955. Masticatory apparatus in the spectacled bear, Tremarctos ornatus. Fieldiana: Zoology 37: 25–46. Crossref
Davis, D.D. 1964. The Giant Panda: A morphological study of evolutionary mechanisms. Fieldiana Zoology Memoirs 3: 1–339. Crossref
Davis, J.L., Santana, S.E., Dumont, E.R., and Grosse, I.R. 2010. Predicting bite force in mammals: two-dimensional versus three-dimensional lever models. Journal of Experimental Biology 213: 1844–1851. Crossref
Druzinsky, R.E., Doherty, A.H., and De Vree, F.L. 2011. Mammalian masticatory muscles: Homology, nomenclature, and diversification. Integrative and Comparative Biology 51: 224–234. Crossref
Ellis, J.L., Thomason, J.J., Kebreab, E., and France, J. 2008. Calibration of estimated biting forces in domestic canids: comparison of post‐mortem and in vivo measurements. Journal of Anatomy 212: 769–780. Crossref
Endo, H., Taru, H., Yamamoto, M., Arishima, K., and Sasaki, M. 2003. Comparative morphology of the muscles of mastication in the giant panda and the asiatic black bear. Annals of Anatomy–Anatomischer Anzeiger 185: 287–292. Crossref
Erxleben, J.C.P. 1777. Systema regni animalis per classes, ordines, genera, species, varietates cvm synonymia et historia animalivm. Classis I. Mammalia. 754 pp. Impensis Weygandianis, Leipzig. Crossref
Evans, H.E. and De Lahunta, A. 2013. Miller’s Anatomy of The Dog, Fourth Edition. 850 pp. Saunders, China.
Fricano, E.E. and Perry, J.M. 2019. Maximum Bony Gape in Primates. The Anatomical Record 302: 215–225. Crossref
Gelfo, J.N. and Pascual, R. 2001. Peligrotherium tropicalis (Mammalia, Dryolestida) from the early Paleocene of Patagonia, a survival from a Mesozoic Gondwanan radiation. Geodiversitas 23: 369–379.
Gill, P.G., Purnell, M.A., Crumpton, N., Brown, K.R., Gostling, N.J., Stampanoni, M., and Rayfield, E.J. 2014. Dietary specializations and diversity in feeding ecology of the earliest stem mammals. Nature 512: 303–305. Crossref
Greaves, W.S. 1995. Functional predictions from theoretical models of the skull and jaws in reptiles and mammals. In: J.J. Thomason (ed.), Functional Morphology in Vertebrate Paleontology, 99–115. Cambridge University Press, Cambridge.
Greaves, W.S. 2012. The Mammalian Jaw: A Mechanical Analysis. 114 pp. Cambridge University Press, Cambridge. Crossref
Griffiths, M. 1978. The Biology of The Monotremes. 367 pp. Academic Press, New York. Crossref
Grossnickle, D.M. 2017. The evolutionary origin of jaw yaw in mammals. Scientific reports 7: 1–13. Crossref
Grossnickle, D.M. 2020. Jaw roll and jaw yaw in early mammals. Nature 582: E6–E8. Crossref
Grossnickle, D.M., Weaver, L.N., Jäger, K.R.K., and Schultz, J.A. 2021. The evolution of anteriorly directed molar occlusion in mammals. Zoological Journal of the Linnean Society [published online https://doi.org/10.1093/zoolinnean/zlab039]. Crossref
Gorniak, G.C. 1986. Architecture of the masticatory apparatus in eastern raccoons (Procyon lotor lotor). American Journal of Anatomy 176: 333–351. Crossref
Gould, S.J. and Vrba, E.S. 1982. Exaptation–a missing term in the science of form. Paleobiology 8: 4–15. Crossref
Harper, T., Parras, A., and Rougier, G.W. 2019. Reigitherium (Meridiolestida, Mesungulatoidea) an enigmatic Late Cretaceous mammal from Patagonia, Argentina: Morphology, affinities, and dental evolution. Journal of Mammalian Evolution 26: 447–478. Crossref
Hartstone‐Rose, A., Perry, J.M., and Morrow, C.J. 2012. Bite force estimation and the fiber architecture of felid masticatory muscles. The Anatomical Record 295: 1336–1351. Crossref
Herring, S.W. and Scapino, R.P. 1973. Physiology of feeding in miniature pigs. Journal of Morphology 141: 427–460. Crossref
Hiiemae, K. and Jenkins, F.A. 1969. The anatomy and internal architecture of the muscles of mastication in Didelphis marsupialis. Postilla 140: 1–49.
Hiiemae, K.M. and Crompton, A.W. 1985. Mastication, food transport and swallowing. In: M. Hilderbrand, D.M. Bramble, K.F. Liem, and D.B. Wake (eds.), Functional Vertebrate Morphology, 262–290. Harvard University Press, Cambridge. Crossref
Hylander, W.L. 1979. The functional significance of primate mandibular form. Journal of Morphology 160: 223–239. Crossref
Hylander, W.L. and Johnson, K.R. 1994. Jaw muscle function and wishboning of the mandible during mastication in macaques and baboons. American Journal of Physical Anthropology 94: 523–547. Crossref
Jäger, K.R.K., Cifelli, R.L., and Martin T. 2020. Molar occlusion and jaw roll in early crown mammals. Scientific Reports 10: 1–12. Crossref
Kay, R.F. and Hiiemae, K.M. 1974. Jaw movement and tooth use in recent and fossil primates. American Journal of Physical Anthropology 40: 227–256. Crossref
Kielan-Jaworowska, Z., Cifelli, R.L., and Luo, Z.X. 2005. Mammals From The Age of Dinosaurs: Origins, Evolution, and Structure. 630 pp. Columbia University Press, New York. Crossref
Kneepkens, A.F.L.M. and MacDonald, A.A. 2010. Cranial muscles of the Sulawesi Babirusa (Babyrousa celebensis). Anatomia Histologia Embryologia: Journal of Veterinary Medicine 39: 120–137. Crossref
Kristjanson, H.L. 2019. Tupaiid Masticatory Anatomy and The Application of Extant Analogs to Reconstructing Plesiadapiform Jaw Adductors. 331 pp. Doctoral dissertation, Johns Hopkins University, Baltimore.
Lautenschlager, S. 2013. Cranial myology and bite force performance of Erlikosaurus andrewsi: a novel approach for digital muscle reconstructions. Journal of Anatomy 222: 260–272. Crossref
Lautenschlager, S., Gill, P., Luo, Z.X., Fagan, M.J., and Rayfield, E.J. 2017. Morphological evolution of the mammalian jaw adductor complex. Biological Reviews 92: 1910–1940. Crossref
Lillegraven, J.A., Kielan-Jaworowska, Z., and Clemens, W.A. (eds.) 1979. Mesozoic Mammals: the First Two-thirds of Mammalian History 311 pp. University of California Press, Berkeley.
Link, H.F. 1795. Ueber die Lebenskräfte in naturhistorischer Rücksicht und die Classification der Säugethiere. 127 pp. Stiller, Rostock.
Linnaeus, C. 1758. Systema naturæ per regna tria naturæ, secundum classes, ordines, genera, species, cum characteribus, differentiis, synonymis, locis. Tomus I. Editio decima, reformata. 824 pp. Laurentius Salvius, Stockholm. Crossref
Lucas, P.W. 2004. Dental Functional Morphology: How Teeth Work. 355 pp. Cambridge University Press, Cambridge. Crossref
Marshall, L.G., Sempere, T., and Butler, R.F. 1997. Chronostratigraphy of the mammal-bearing Paleocene of South America. Journal of South American Earth Sciences 10: 49–70. Crossref
Martinelli, A.G., Soto-Acuña, S., Goin, F.J., Kaluza, J., Bostelmann, E., Fonseca, P.H.M., Reguero, M.A., Leppe, M., and Vargas, A.O. 2021. New cladotherian mammal from southern Chile and the evolution of mesungulatid meridiolestidans at the dusk of the Mesozoic era. Scientific Reports 11: 1–18. Crossref
Martín-Serra, A. and Benson, R.B.J. 2020. Developmental constraints do not influence long-term phenotypic evolution of marsupial forelimbs as revealed by interspecific disparity and integration patterns. The American Naturalist 195: 547–560. Crossref
McHenry, C.R., Wroe, S., Clausen, P.D., Moreno, K., and Cunningham, E. 2007. Supermodeled sabercat, predatory behavior in Smilodon fatalis revealed by high-resolution 3D computer simulation. Proceedings of the National Academy of Sciences 104: 16010–16015. Crossref
Meng, J., Hu, Y., Wang, Y., Li, C. 2003. The ossified Meckel’s cartilage and internal groove in Mesozoic mammaliaforms: Implications to origin of the definitive mammalian middle ear. Zoological Journal of the Linnean Society 138: 431–448. Crossref
Paéz-Arango, N.P. 2008. Dental and Craniomandibular Anatomy of Peligrotherium tropicalis: The Evolutionary Radiation of South American Dryolestoid Mammals. 116 pp. Master’s Thesis, University of Louisville, Louisville.
Perry, J.M., Hartstone-Rose, A., and Logan, R.L. 2011. The jaw adductor resultant and estimated bite force in primates. Anatomy Research International 2011: 1–11. Crossref
Reed, D.A., Iriarte‐Diaz, J., and Diekwisch, T.G.H. 2016. A three dimensional free body analysis describing variation in the musculoskeletal configuration of the cynodont lower jaw. Evolution & Development 18: 41–53. Crossref
Ross, C.F., and Iriarte-Diaz, J. 2019. Evolution, constraint, and optimality in primate feeding systems. In: V. Bels and I.Q. Whishaw (eds.) Feeding in Vertebrates, 787–829. Springer, Cham. Crossref
Rougier, G.W., Apesteguía, S., and Gaetano, L.C. 2011. Highly specialized mammalian skulls from the Late Cretaceous of South America. Nature 479: 98–102. Crossref
Rougier, G.W., Forasiepi, A.M., Hill, R.V., and Novacek, M. 2009. New mammalian remains from the Late Cretaceous La Colonia Formation, Patagonia, Argentina. Acta Palaeontologica Polonica 54: 195–212. Crossref
Rougier, G.W., Turrazzinni G.F., Cardozo, M.S., Harper, T., Lires, A.I., and Canessa, L.A. 2021. New specimens of Reigitherium bunodontum from the La Colonia Formation, Patagonia, Argentina and meridiolestidan diversity in South America. Journal of Mammalian Evolution 28: 1051–1081. Crossref
Rougier, G.W., Wible, J.R., Beck, R.M., and Apesteguía, S. 2012. The Miocene mammal Necrolestes demonstrate the survival of a Mesozoic nontherian lineage into the late Cenozoic of South America. Proceedings of the National Academy of Science 109: 20053–20058. Crossref
Santana, S.E., Dumont, E.R., and Davis, J.L. 2010. Mechanics of bite force production and its relationship to diet in bats. Functional Ecology 24: 776–784. Crossref
Schroeder, W.J., Martin, K., and Lorensen, B. 2006. The Visualization Toolkit: An Object–Oriented Approach to 3D Graphics: 4th Edition. 512 pp. Kitware, Clifton Park. Crossref
Schultz, J.A. and Martin, T. 2014. Function of pretribosphenic and tribosphenic mammaloian molars inferred from 3D animation. Naturwissenschaften 101: 771–781. Crossref
Sutton, M.D., Rahman, I.A., and Garwood, R. 2016. Virtual paleontology—an overview. Paleontological Society Papers 22: 1–20. Crossref
Tseng, Z.J., Grohé, C., and Flynn, J.J. 2016. A unique feeding strategy of the extinct marine mammal Kolponomos: convergence on sabretooths and sea otters. Proceedings of the Royal Society B: Biological Sciences 283: 1–8. Crossref
Turnbull, W.D. 1970. Mammalian masticatory apparatus. Fieldiana: Geology 18: 149–356.
Vinyard, C.J., Williams, S.H., Wall, C.E., Doherty, A.H., Crompton, A.W., and Hylander, W.L. 2011. A preliminary analysis of correlations between chewing motor patterns and mandibular morphology across mammals. Integrative and Comparative Biology 51: 260–270 Crossref
Wall, C.E. and Krause, D.W. 1992. A biomechanical analysis of the masticatory apparatus of Ptilodus (Multituberculata). Journal of Vertebrate Paleontology 12: 172–187. Crossref
Weijs, W.A. 1994. Evolutionary approach of masticatory motor patterns in mammals. In: V.L. Bels, M. Chardon, and P. Vandewalle (eds.), Biomechanics of Feeding in Vertebrates, 281–320. Springer, Berlin. Crossref
Werneburg, I. 2013. The tendinous framework in the temporal skull region of turtles and considerations about its morphological implications in amniotes: a review. Zoological Science 30: 141–153. Crossref
Wible, J.R. and Rougier, G.W. 2017. Craniomandibular anatomy of the subterranean meridiolestidan Necrolestes patagonensis Ameghino, 1891 (Mammalia, Cladotheria) from the early Miocene of Patagonia. Annals of Carnegie Museum 84: 183–252. Crossref
Williams, S.H., Wall, C.E., Vinyard, C.J., and Hylander, W.L. 2008. Symphyseal fusion in selenodont artiodactyls: New insights from in vivo and comparative data. In: C. Vinyard, M.J. Ravosa, and C. Wall (eds.), Primate Craniofacial Function and Biology, 39–61. Springer, Boston. Crossref
Woodburne, M.O. 1968. The cranial myology and osteology of Dicotyles tajacu, The Collared Peccary, and its bearing on classification. Memoirs of The Southern California Academy of Sciences 7: 1–48. Crossref
Zhou, Z., Winkler, D.E., Fortuny, J., Kaiser, T.M., and Marcé-Nogué, J. 2019. Why ruminating ungulates chew sloppily: Biomechanics discern a phylogenetic pattern. PloS One 14: 1–21. Crossref
Acta Palaeontol. Pol. 67 (1): 177–201, 2022
https://doi.org/10.4202/app.00912.2021