

Iridescent plumage in a juvenile dromaeosaurid theropod dinosaur
ANGUS D. CROUDACE, CAIZHI SHEN, JUNCHANG LÜ, STEPHEN L. BRUSATTE, and JAKOB VINTHER
Croudace, A.D., Shen, C., Lü, J., Brusatte, S.L., and Vinther, J. 2023. Iridescent plumage in a juvenile dromaeosaurid theropod dinosaur. Acta Palaeontologica Polonica 68 (2): 213–225.
Colour reconstructions have provided new insights into the lives of dinosaurs and other extinct animals, by predicting colouration patterns from fossilised pigment-bearing organelles called melanosomes. Although these methods have become increasingly popular, only a small number of dinosaurs have been studied using these techniques, which require exceptional preservation of fossil feathers, leaving open key questions such as whether dinosaurs changed their plumage patterns during ontogeny. Here we reconstruct the feather colouration of an approximately one-year-old individual of the Early Cretaceous dromaeosaurid theropod Wulong bohaiensis, which to our knowledge is the first unequivocal juvenile paravian for which aspects of the original colour has been predicted. Using quadratic discriminant analysis (QDA) and multinomial logistic regression (MLR) on the most comprehensive available datasets, we find strong evidence for iridescent plumage of the forelimb and hindlimb remiges and grey plumage on other portions of the body. This suggests that some juvenile paravians used shiny iridescent feathers for signalling purposes, possibly even before reaching somatic or sexual maturity, and thus we can conclude that this paravian used iridescent signalling for intraspecific communication other than sexual signalling. Finally, our results show that when analysing fossil datasets that are entirely comprised of solid and cylindrical melanosomes QDA consistently outperforms MLR, providing more accurate and higher classification probability colour predictions.
Key words: Dinosauria, Theropoda, Dromaeosauridae, Paraves, Wulong bohaiensis, iridescence, melanosome, palaeocolour, juvenile, colour reconstruction, Cretaceous, China.
Angus D. Croudace [anguscroudace@yahoo.co.uk; ORCID: https://orcid.org/0009-0006-3557-9421 ] and Stephen L. Brusatte [stephen.brusatte@ed.ac.uk; ORCID: https://orcid.org/0000-0001-7525-7319 ], School of Geosciences, University of Edinburgh, Grant Institute, James Hutton Road, Edinburgh, Scotland, EH9 3FE, UK.
Caizhi Shen [shencaizhi00@163.com; ORCID: https://orcid.org/0000-0002-2485-1489 ], Dalian Natural History Museum, Dalian, Liaoning 116023, China.
Junchang Lü, Institute of Geology, Chinese Academy of Geological Sciences, Beijing, China. Passed away on October 9, 2018.
Jakob Vinther [jakob.vinther@bristol.ac.uk; ORCID: https://orcid.org/0000-0002-3584-9616 ], School of Earth Sciences, University of Bristol, Bristol, England, UK; School of Biological Sciences, University of Bristol, Bristol, England, UK.
Received 30 April 2023, accepted 5 May 2023, available online 13 June 2023.
Copyright © 2023 A.D. Croudace et al. This is an open-access article distributed under the terms of the Creative Commons Attribution License (for details please see http://creativecommons.org/licenses/by/4.0/), which permits unrestricted use, distribution, and reproduction in any medium, provided the original author and source are credited.
Introduction
Since the discovery of fossil melanosomes—organelles containing melanin pigment (Vinther et al. 2008)—inference of original colours and colour pattern has offered new insights to the lives and appearances of dinosaurs (Li et al. 2010, 2012; Vinther 2016; Brown et al. 2017; Hu et al. 2018). It has offered an insight to the dynamics between vision and colour in the Mesozoic and the degree to which non-avian dinosaurs already exhibited several traits we know from crown group birds. Birds are highly visual in their behaviour, both in their modes of predation as well as in intraspecific communication. They therefore exhibit some of the most remarkable ranges of colour patterns seen in the animal kingdom (Stoddard and Prum 2008).
Amongst the unique traits of birds is their common expression of iridescence (Prum 2006). This type of structural colouration is generated by coherent scattering of certain light waves within the feather barbules through distinct layering of melanosomes close to the barbule surface. Due to the difference in refractive index between melanin, keratin and sometimes also air, specific light waves refract when these phases are organised into a nanostructure, ranging from a simple thin film composed of a smooth layer of keratin above a smooth layer of melanosomes into quasi-ordered 2D photonic nanostructures (Prum 2006). While sometimes being employed in camouflage, such as the bright, green plumage on the backs of hummingbirds, iridescence is more commonly thought to be utilised in signalling (Stuart-Fox et al. 2021).
While one fossil feather from the Eocene Messel oil shale has been shown to preserve the original melanosome nanostructure that gave rise to thin film iridescence in life (Vinther et al. 2009; Vitek et al. 2013) the state of preservation in non-avian dinosaurs from Northeastern China complicates identification of such nanostructures because they experienced a higher degree of burial compaction and thermal alteration, resulting in condensation reactions. Additional oxidation by late-stage meteoric weathering has left mainly imprints in the rock matrix or associated kerogen matrix behind to be studied (Vinther 2020). However, it has been demonstrated that iridescent nanostructures are composed by melanosomes with a unique range of morphologies distinct from melanosomes involved in generating melanin-based colouration (Li et al. 2012; Nordén et al. 2019) or non-iridescent structural colour (Babarović et al. 2019). This has allowed for the identification of iridescence in plumage in paravian and enantiornithine stem group birds (Li et al. 2012; Peteya et al. 2017) including flattened melanosomes that would incur highly bright iridescent hues (Hu et al. 2018).
Iridescent nanostructures only occur within barbules of a feather, which evolutionarily appear to have evolved amongst the maniraptorans and more derived paravians. It is therefore noteworthy that iridescence has been encountered amongst different paravians (Li et al. 2012, Hu et al. 2018) attesting to a close coincidence between the origin of the structural component hosting the colour and its first occurrence. Additionally, iridescence seems to have evolved convergently on multiple occasions amongst crown group birds (Nordén et al. 2019, 2021).
Despite the many possible hypotheses melanosome-based colour reconstructions could offer to elucidate for understanding the evolution of birds and their ecology, only a handful of non-avian dinosaurs have been studied so far, which prevents thorough understanding of the role and significance of iridescence during this crucial formative phase of avian evolution. From the perspective of understanding non-avian dinosaur ecology, many other questions arise. How did plumage vary within a species, such as possible sexual dimorphism or changes throughout ontogeny? To elucidate sexual dichromatism a large sample set is needed with multiple well preserved specimens preserving plumage. The question as to ontogenetic changes can be elucidated with a sample of juvenile and adult specimens of the same species. Did dinosaurs change feather colour and patterns as they matured from juveniles to adults, as is the case for many extant birds?
Here, we reconstruct the plumage colouration of a specimen of Wulong bohaiensis Poust, Gao, Varricchio, Wu, and Zhang, 2020 (DNHM D2933) (Poust et al. 2020), an Early Cretaceous feathered microraptorine dromaeosaurid from the Jehol Biota of Liaoning, China. Osteological and bone histological analyses reveal that this individual is a juvenile and was approximately one year old and still growing when it died (Poust et al. 2020). Using updated evaluation of statistical approaches to determine best methods for robust palaeocolour prediction on the most comprehensive available dataset, we identify Wulong bohaiensis DNHM D2933 as possessing iridescent plumage. Wulong bohaiensis DNHM D2933 is the first juvenile paravian, to our knowledge, whose colour has been reconstructed. While identifying a possible signalling role of the plumage in a juvenile is of interest; the absence of available adult specimens precludes further understanding of this species’ ecology. However, it highlights the obvious potential for understanding the role of plumage colours during ontogenetic stages by exploring and studying more fossil specimens in a larger comparative framework. This could potentially reveal juvenile versus adult plumage, sexual dichromatism and cryptic species, furthering our understanding of non-avian dinosaur ecology and bird evolution.
Institutional abbreviations.—DNHM, Dalian Natural History Museum, Dalian, China.
Other abbreviations.—AIC, Akaike information criterion; LOOCV, leave-one-out cross-validation; MLR, multinomial logistic regression; QDA, quadratic discriminant analysis.
Material and methods
Methods for inferring fossil colour.—Melanin based colouration is the most prevalent source of colouration amongst vertebrates (Riley 1997) and is also the pigment with the best understood preservation potential and means for detection in fossils (Vinther 2020). Two distinct chemical varieties exist amongst vertebrates, which are eumelanin and pheomelanin (McGraw 2006). Eumelanin-rich melanosomes are oblate and produce shades of black (Prota 1988), whereas phaeomelanin rich melanosomes are smaller and ovoid in shape and produce rufous to gingery brown colours (Liu and Simon 2003). A correlation between colour and shape enables the use of statistical methods to predict fossil colour using a dataset of extant melanosome measurements (Li et al. 2010).
To reconstruct the original colour that the melanosomes could have generated in Wulong bohaiensis DNHM D2933, we used the dataset of Nordén and colleagues (Nordén et al. 2019) to predict colour using two models: quadratic discriminant analysis (QDA) and multinomial logistic regression (MLR). This dataset was developed from that of Li et al. (2012), which consisted of 150 extant taxa (including 45 black, 35 brown, 35 grey, and 35 iridescent species). A later study of Hu et al. (2018) also expanded the Li et al. (2012) dataset by adding another 32 iridescent species which mostly consisted of hummingbirds. Then Nordén et al. (2019) supplemented the dataset further with 124 new iridescent samples with a broader phylogenetic distribution, bringing the maximum number of iridescent samples available for our analysis to 191. This is a large increase in the quantity of iridescent samples from the original and this may be important for performance of the two models.
Nordén et al. (2019) noticed that iridescent melanosomes that are hollow or flat fail to be represented accurately using the measurements previously implemented for QDA (Li et al. 2012). The hollow and flat melanosomes that occur in some brightly iridescent bird feathers may become conflated with grey and non-iridescent structural coloured melanosomes if only simple continuous measurements of melanosomes, i.e., lengths and diameters are considered, such as in QDA. By including categorical variables, such as “hollow/solid” and “flat/cylindrical” alongside the previously chosen variables (Li et al. 2012) which represent only solid cylindrical melanosomes (ranging from oblate to ovoid), Nordén et al. (2019) was able to better distinguish (more accurately classify) the expanded dataset of iridescent melanosomes using MLR. This classification method necessitates assessment of melanosomes being hollow or flattened in fossil specimens in addition to simple length and diameter measurements of a representative sample.
Nordén et al. (2019) showed the importance of including categorical variables by adding them into the training dataset and comparing an MLR classification output with that of a QDA, using the first documented fossil flat melanosomes on Caihong as a test case. The outputs revealed iridescence (99% classification probability) for the melanosomes in this fossil taxon using MLR, but grey using QDA (also 99% classification probability). They also reported that MLR performed better, in terms of accuracy, than QDA on the same training data (83% vs 73% accuracy on this dataset).
In our study of Wulong bohaiensis DNHM D2933, we re-evaluate the approaches and advice offered by Nordén et al. (2019), with particular attention given to dataset composition and the performance of QDA and MLR with models including two categorical variables. We examine which modelling approach might be the best to use and consider which variables should be included in the training data. We find that for studying only solid cylindrical to ovoid melanosomes in fossils, excluding the flattened and hollow iridescent melanosomes from the training dataset and using QDA offers the best predictions with highest accuracy.
Sampling and electron microscopy.—A total of 16 plumage samples from DNHM D2933 were taken by Zhang Yuqing, under the supervision of SLB, CS, and JL. The samples are each a few millimetres in size and labelled 1–16. They cover a broad spread of the dinosaur’s body (see Fig. 1) and avoided the torso between ribs and gastralia, where potential confusion with internal organ melanosomes is possible (McNamara et al. 2018). Upon inspection, here it is clear that the sampled areas are situated outside the abdominal region. There is no evidence of the abdomen having ruptured during decay, as evidenced by the in-situ localisation of the gastralia.
Each sample was soaked in acetone for 24 hours to remove any paraloid consolidant coating that may obscure detection of preserved microstructures. The samples were subsequently mounted to individual stubs, photographed under a binocular microscope for reference, and a thin gold coat sputtering was applied with a BalTec SCD050. They were then imaged on a Zeiss SIGMA HD VP FEG scanning electron microscope (SEM) at an accelerating voltage of 15 kV, and a typical working distance of 7 mm. Each accompanying digital photograph enabled simple and thorough exploration across each sample.
Some samples had been destructively sampled for chemical analyses and weren’t available for study. Melanosomes were suitably well preserved in 8 of the remaining 16 samples (n = 13 to 156 measurements per sample). These samples revealed impressions of cylindrical microbodies consistent in morphology and alignment to melanosomes originally embedded within feather matrix. Samples that did not reveal any melanosomes are likely to reflect artefacts of exposure, weathering and nature of splitting as opposed to a lack of melanosomes that would make those regions unpigmented.

Fig. 1. Dromaeosaurid dinosaur Wulong bohaiensis Poust, Gao, Varricchio, Wu, and Zhang, 2020 (DNHM D2933), from Shangheshou, Chaoyang, Liaoning, China, Early Cretaceous Jiufotang Formation with a minimum age of 120.3 Ma (A1). Samples 1–16 were labelled by SLB while taking samples at the museum. Illustration by JV (A2) to show distinct plumage groupings on Wulong bohaiensis (DNHM D2933). For clarity, in this illustration only the samples with successful melanosome preservation are labelled. Preservation on each of the excluded samples was not sufficient for study.
Melanosome measurements.—SEM images were inspected using the image-processing software ImageJ version 1.52a (Schneider et al. 2012). While several melanosomes can be observed in each image, often with intact alignment, measurements from several images were needed to obtain a sufficient quantity of melanosome measurements. The mean length, diameter and aspect ratio were calculated for each sample based on this series of measurements. Following the updated approach of Nordén et al. (2019), coefficient of variation and skew variables were not included. A reliability analysis was carried out to investigate the potential effects of experimenter on the ImageJ measurements. Two colleagues, Ffion Robb and Kim Kean, measured multiple sets of measurements from the same two samples. Differences ranged from 0.14–11.8% (see SOM: table S1, Supplementary Online Material available at http://app.pan.pl/SOM/app68-Croudace_etal_SOM.pdf); however, the predicted colour category remained the same when tested. Therefore, any effect of the examiner is considered to be small, and not substantial enough to affect the colour predictions.
As well as quantitative data for continuous measures, e.g., length and diameter, categorical variables for hollowness (hollow/solid) and flatness (flat/cylindrical) were included. The cylindrical nature was determined by eye by assessing the melanosome imprints at different angles. Hollowness is impossible to determine precisely from our data without further analysis such as focused ion beam scanning electron microscopy (FIB-SEM). However, considering that most melanosome imprints from Wulong bohaiensis DNHM D2933 appear to be quite narrow (too narrow to have been originally hollow), and given the rarity of hollow melanosomes even amongst iridescent nanostructures (Nordén et al. 2021), we have erred on the side of caution by analysing our data on the assumption that the melanosomes from Wulong bohaiensis DNHM D2933 are solid and cylindrical. This could be reassessed in the future with better preserved specimens. Melanosome density, which has been shown to contribute to colour brightness (Field et al. 2013) but not colour category (Li et al. 2010, 2012), was not assessed in this study, which focused on the predicted iridescence of parts of the plumage.
Fig. 2 shows a selection of characteristic melanosomes for each successful sample, with average measurements included in SOM: table S2. Sample 15 is from the chest region of the abdomen. Multiple unique populations of melanosomes were observed with differing morphologies. These were treated as separate samples (15a, 15b, and 15c) and assessed for their colour. Fig. 3 plots length against diameter for the melanosome data, with the right-most panel including the measurements from Wulong bohaiensis DNHM D2933 facilitating visual comparison of the colour category distributions in the first four panels.
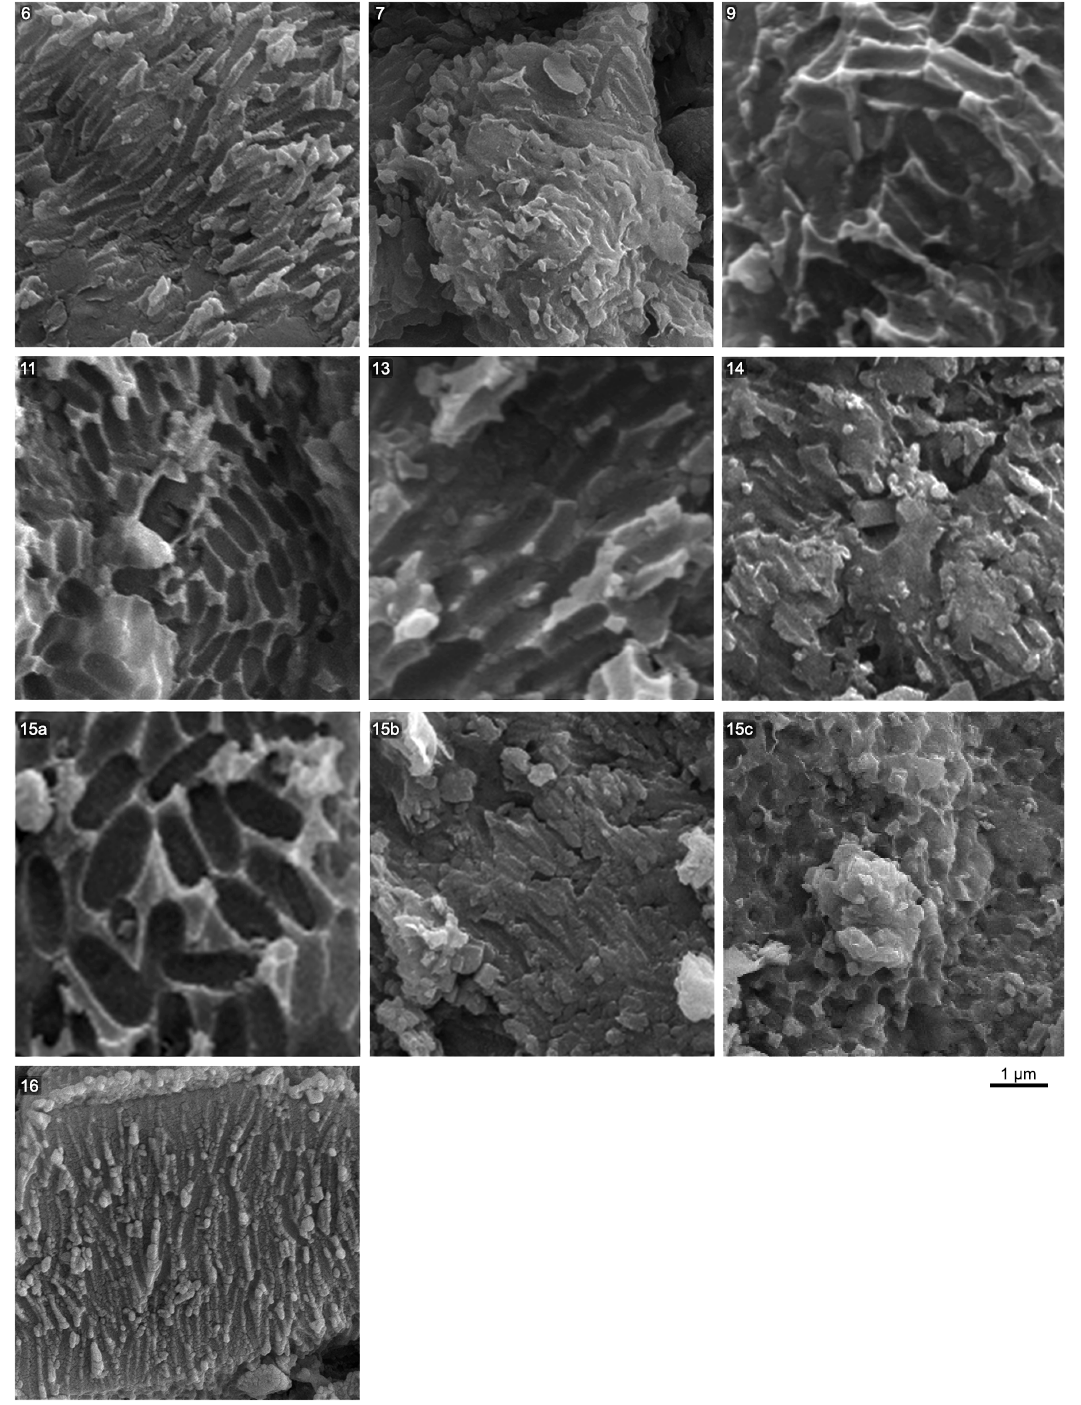
Fig. 2. Preserved melanosome imprints characteristic of each sample from the dromaeosaurid dinosaur Wulong bohaiensis Poust, Gao, Varricchio, Wu, and Zhang, 2020 (DNHM D9233) from Shangheshou, Chaoyang, Liaoning, China, Early Cretaceous Jiufotang Formation with a minimum age of 120.3 Ma. All melanosome imprints are from solid and cylindrical melanosomes. Preservation on samples 7 and 14 is less clear. Three distinctive types of melanosome morphology were found on sample 15. Each was measured separately and treated as different samples for analysis (15a/15b/15c).
Accounting for melanosome shrinkage.—Only melanosome imprints were available for study, which have been argued to preserve the original morphology better than organically preserved melanosomes (Vinther 2020). Organically preserved melanosomes appear to shrink isometrically up to ~20% (McNamara et al. 2013; Colleary et al. 2015). The assumption is that if the rock matrix formed earlier than the diagenetic shrinkage taking place, then imprints are a better proxy for the original size. While aspect ratio is unaffected by shrinkage, the length and diameter would be affected and could affect predictions. To inspect this effect, three scaling compensations of 10%, 20%, and 30% for length and diameter have been applied to investigate any possible shift in prediction.
Colour prediction.—In this study, the two prevailing predictive modelling approaches (QDA and MLR) for analysing fossil melanosome shape were applied to each of the datasets (see Table 1), using length, diameter and aspect ratio as predictor variables for the QDA. For MLR, diameter, aspect ratio, hollowness (categorical) and flatness (categorical) predictor variables were used. The analyses were conducted in Stata-16 (StataCorp 2019a), see SOM for commands to execute the models and justifications for the variable selection.
The first dataset “LiNord” incorporates the Nordén et al. (2019) modifications of the original Li et al. (2012) dataset where, to avoid systematic bias from different sampling methods and sample sizes, coefficient of variation and skew variables were excluded, as well as all samples with a sample size less than 10. It does not include any of the new additional samples from Hu et al. (2018) or Nordén et al. (2019).
The second dataset “NordSC” is a revised version of the expanded Nordén et al. (2019) dataset. First, a minor correction reassigned colour categories to four samples that were mislabelled (see SOM). Nordén et al. (2019) also excluded the species sampled by Hu et al. (2018) because the data was not phylogenetically broad, instead creating their own, broader iridescent dataset. Additionally, here all hollow and flat samples provided by Nordén et al. (2019) were excluded to evaluate the nature of this dataset in discriminant analyses (QDA) in comparison to MLR. Based on the cautious assumption that the melanosomes from Wulong bohaiensis DNHM D2933 are solid and having assessed them as being cylindrical rather than flat, restricting the “NordSC” dataset to only solid and cylindrical samples allows the model to utilise the variability and associations among the continuous variables included in QDA, for making colour category predictions.
Finally, the full, expanded Nordén et al. (2019) dataset was included to replicate their method, referred to as “Nordén”, which also features the four data corrections mentioned for NordSC. This dataset provides an opportunity to compare the application of QDA across different datasets, focussing on the effects of including hollow and flat samples.
Table 1. Summary of dataset sample construction for this study. See SOM for full sample data.
|
Dataset |
Original source |
Original content |
Modifications |
Updated content |
|
LiNord |
45 black |
Samples with measurement sample size <10 excluded to reduce bias and inaccuracy from high variability of low sample sizes, as in Nordén et al. (2019). Pica pica sample removed because melanosomes were deemed to be hollow (Nordén et al. 2019). |
27 black |
|
|
NordSC |
27 black |
All hollow and/or flat samples excluded because all fossil melanosomes from Wulong have been analysed under the assumption that they are solid and cylindrical. Colour categories were also corrected for four rows of mislabelled data. |
27 black |
|
|
Nordén |
27 black |
Colour categories corrected for four rows of data. |
27 black |
QDA.—QDA’s value arises when continuous predictors vary in their association across groups, as in the “LiNord” and “NordSC” datasets. Analysis Q1 applied QDA to the “LiNord” dataset, and analysis Q2 applied QDA to the “NordSC” dataset. The colour category group sizes are uneven in both datasets and so the QDA training group prior probabilities were calculated from individual group size for both Q1 and Q2. Although the exclusion of hollow and flat samples significantly reduces the imbalance, there is still a considerably higher proportion of iridescent measurements in the “NordSC” dataset, which may still affect or bias iridescent predictions. Predictor variables were entered together into each QDA analysis, rather than using stepwise selection (see SOM). A further QDA test was applied to the complete “Nordén” dataset (analysis Q3), to evaluate the decision to exclude all hollow and flat iridescent samples in QDA. It is expected that these results will differ substantially from analyses Q1 and Q2 due to the increased number of iridescent samples featuring a varied morphology. Some of the hollow and flat samples conflate with grey melanosomes and rely on their categorical variables for distinction, which QDA potentially may not optimally incorporate.
MLR.—MLR is arguably more suitable and may give more optimal classifications when predictors include binary variables (Mehmetoglu and Jakobsen 2017), such as hollowness and flatness variables in this study. MLR, though more complex, is therefore useful to accompany and contrast with QDA, providing a valuable comparison for predicted classifications.
Here, we implemented classification from MLR with logistic discriminant analysis (LogisticDA). Conveniently, LogisticDA provides a classification output directly. Fortunately, since MLR is the basis for LogisticDA (StataCorp 2019b), applying MLR via LogisticDA allows for immediate and simple access to the classification results for predicted colour category. For simplicity, and because it is shown to be equivalent (see SOM), this approach will still be referred to as MLR hereafter to retain a connection with previous equivalent methods (Nordén et al. 2019).
Our MLR analyses used “LiNord” for analysis M1 and “NordSC” to train analysis M2. As with QDA, the MLR training group prior probabilities were calculated from individual group size because the group sizes are uneven. Stepwise variable entry was avoided by using AIC values (see SOM) for selection of variables in the models. This resulted in diameter, aspect ratio, hollowness and flatness being included as predictors, with length being excluded. Finally, analysis M3 applied MLR to the “Nordén” dataset, to facilitate the comparison of this study’s novel “NordSC” dataset with results that emulate those of Nordén et al. (2019).
Comparing performance of MLR versus QDA.—Performance of analyses Q1, Q2, and M1–3 was described and reported in several ways. The accuracy of Q3 has not been reported because it is expected that the results will be distorted, the inability to optimally incorporate categorical variables already mentioned is undetectable by the model or by any performance tests.
Performance was tested on each of the three training datasets without the inclusion of fossil samples. First, an accuracy self-test calculated the percentage of training dataset sample classifications correctly predicted by one application of the model. Further to this, cross-validation was also used, calculated in two ways; first using leave-one-out cross-validation (LOOCV), and then using repeated k-fold cross-validation (see SOM). The small data subsets of the latter reduce potential prediction error from outliers or biased data, resulting in more robust and accurate estimates of test error rate than LOOCV (James et al. 2013). The k-fold cross-validation output provided a value for Cohen’s Kappa, which measures the agreement of the predictions considering the possibility that they might be due to chance. Cohen’s Kappa ranges from 0 (predictions no better than expected from chance) to 1 (perfect agreement). A third performance test on the training data was an accuracy self-test on each colour category in each model, which investigates individual colour category performance and checks for prediction bias.
Finally, model performance was also assessed on the resultant predictions for fossil data by calculating the mean fossil classification probability value. This provides an average of a model’s classification confidence, as in Hu et al. (2018). However, reporting the mean alone may be insufficient to compare models because it does not convey the often-broad range of probabilities calculated in the set of samples. Therefore, to help contextualise the mean, here minimum and maximum probabilities were also reported, showing the range.
Results
Melanosome dimensions and preservation across Wulong bohaiensis DNHM D2933.—From the 16 samples taken we were able to identify microbodies consistent with melanosomes in eight of them (Fig. 2). Their dimensions vary in a visible fashion and are either very wide and oblong or narrow and elongate. One sample region (15, Fig. 2) featured three different populations of melanosomes that were either large (15a), narrow (15b) or quite small and ovoid (15c).
All the melanosomes are preserved as imprints and hence the original melanin has oxidised away. This prevents any assessment for hollowness, while we have tentatively evaluated if it is possible that any melanosomes were flattened in life. It is indeed possible that the very large melanosomes could have been flattened as they conform to their appearance when viewed from above, while if assuming a cylindrical morphology as we have done below, they predict as grey. We didn’t feel compelled from the natural association of the melanosomes and their slightly different orientation to suggest that they might be flattened, and therefore we have assumed a cylindrical morphology. We acknowledge that this conclusion may be shown as incorrect with further scrutiny. However, our conservative conclusions have no bearing on this uncertainty.
Colour predictions.—The colour prediction results of analyses Q1, Q2, M1 and M2 agreed consistently for nine of the ten individual Wulong bohaiensis DNHM D2933 samples, with predictions conforming to iridescent and grey for different samples (see Table 2).
Table 2. Colour classification posterior probabilities for Wulong bohaiensis (DNHM D2933). Each analysis predicted the same colour classification. Colours in bold are predicted accurately by all four analyses.
|
Sample |
Location of sampled feather |
Predicted colour |
Probability (%) |
|||
|
Q1 |
Q2 |
M1 |
M2 MLR NordSC |
|||
|
6 |
distal portion of metatarsus |
iridescent |
99.95 |
99.98 |
95.59 |
97.63 |
|
7 |
distal portion of tibia |
iridescent |
100.00 |
100.00 |
99.08 |
99.37 |
|
9 |
proximal portion of dorsal ilium |
grey |
99.00 |
99.00 |
60.65 |
54.00 |
|
11 |
proximal portion of dorsal ilium |
grey |
99.98 |
99.98 |
72.00 |
68.66 |
|
13 |
unidentifiable forelimb portion |
grey |
99.88 |
99.88 |
69.54 |
66.07 |
|
14 |
proximal portion of forelimb ulna (right) |
iridescent |
68.89 |
88.87 |
62.87 |
84.16 |
|
15a |
not identifiable. Possibly abdomen or forelimb humerus |
grey |
99.96 |
99.96 |
72.54 |
69.59 |
|
15b |
iridescent |
88.09 |
95.08 |
65.38 |
81.26 |
|
|
15c |
grey/brown |
70.50 (grey) |
70.40 (grey) |
82.96 (brown) |
83.19 (brown) |
|
|
16 |
proximal portion of forelimb ulna (left) |
iridescent |
99.82 |
99.92 |
89.26 |
94.29 |
Samples 6, 7, and 16 have all been predicted as iridescent with extremely high probabilities. These samples derive from feather remiges from separate fore and hind limbs (see Fig. 1). Sample 14 is located on a forelimb and is predicted iridescent, but with a more variable probability between models than the other iridescent samples. Together, these results clearly indicate the presence of iridescence across the limbs of Wulong bohaiensis DNHM D2933.
Sample 15a is predicted as grey. Sample 15b also predicts iridescence with lower MLR probability values but very high QDA probabilities. Sample 15c is composed of quite small, wide and distinctly ovoid melanosomes which are predicted as grey by QDA and brown by MLR, the only sample for which predictions do not agree, and an unsurprising result given its outlying position in Fig. 3. As a whole, sample 15 is from the region between the forelimbs and the gastralia. It could therefore be derived from the contour feathers of the chest but could also be partly conflated with tertiary remiges of the forelimb. The fact that different populations of melanosomes are observed in this region suggest the presence of multiple overlapping feathers of different colour, consistent with contour feathers.
Samples 9 and 11 are predicted as showing grey on the main body of Wulong bohaiensis DNHM D2933, above the dorsal ilium. Sample 13 shows part of a forelimb to be grey, although the exact location is unidentified.
Overall, we observe that QDA yields higher predictions for the fossil samples than MLR, most notably for predictions of grey samples. Although slightly lower than corresponding QDA results, iridescent MLR results for Wulong bohaiensis DNHM D2933 are mostly between 90–100% in probability, and hence can be considered robust enough to corroborate our conclusions. Grey MLR predictions however, whilst unanimously matching the results of QDA, are lower and range between 54–72% in probability.
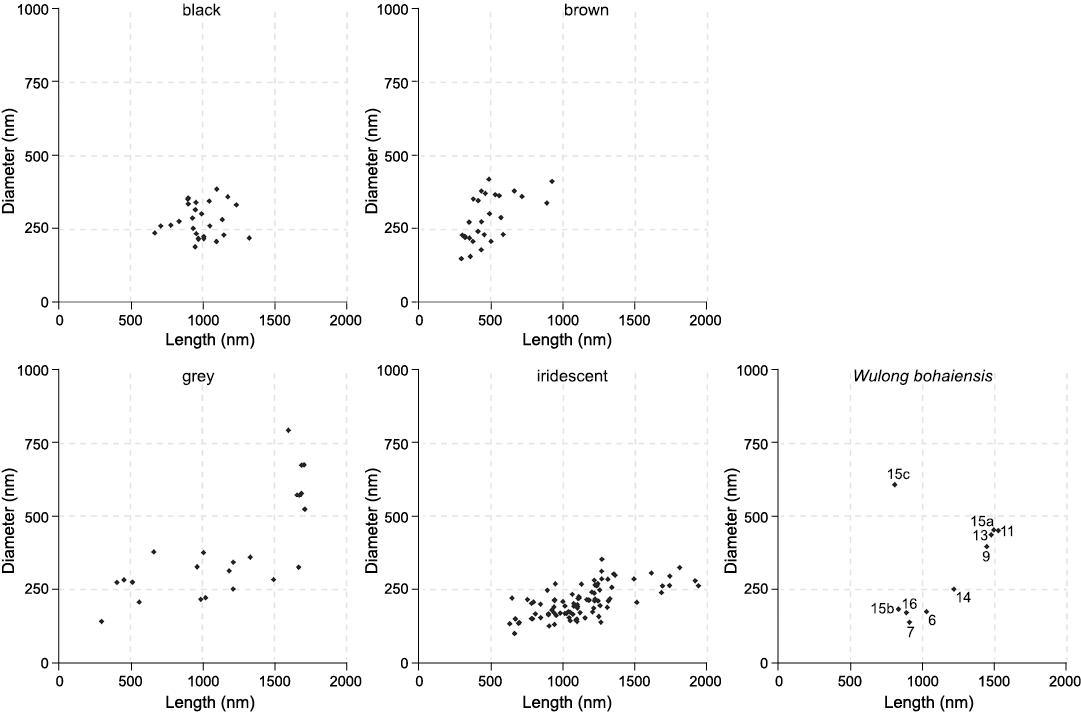
Fig. 3. Melanosome length against diameter for each colour category. The fifth panel shows the measurements for the dromaeosaurid dinosaur Wulong bohaiensis Poust, Gao, Varricchio, Wu, and Zhang, 2020 (DNHM D2933), from Shangheshou, Chaoyang, Liaoning, China, Early Cretaceous Jiufotang Formation with a minimum age of 120.3 Ma. Note 15c, which outlies all extant measurements. This figure is a good visual representation of why the models conflict in their prediction for 15c.
Shrinkage results.—Across analyses Q1, Q2, M1 and M2, just 7.5% (nine results) of all scaled shrinkage predictions vary from the results of the unaltered values (see SOM). Six of these nine results were at the 30% scaling, which exceeds the 20% seen in maturation experiments reported by McNamara et al. (2013) and so is likely an overestimate of actual shrinkage. In addition, all changes are exclusive to samples 14, 15b and 15c, which have some of the lowest classification probabilities across all analyses and hence these scaled predictions are also more susceptible to variation. In summary, shrinkage has negligible effect; all predictions remain robust to any effect of experimental scaling. We note that since our samples entirely preserve as imprints rather than 3D melanosomes, the imprints tend to be larger than co-occurring melanosomes when found together and hence are more likely to record the approximate original melanosome dimensions. Hence, we consider the unscaled dimensions and the predictions made on those to be the most credible ones.
Model and dataset performance.—Contrary to Nordén et al. (2019) who reported MLR performing better than QDA, here QDA performs slightly better than MLR for both “LiNord” and “NordSC” datasets (Table 3). It is also apparent that the dataset used does have an impact on the results. Cohen’s Kappa values result in substantial agreement (values ranging from 0.6–0.8; Landis and Koch 1977) for each analysis in this study: 0.65–0.71. However, when compared respectively, the Kappa values are higher in QDA than MLR, and higher in “NordSC” than “LiNord”.
Most values increase by more than 10% in self-test accuracy and LOOCV results when comparing “NordSC” with “LiNord”, with “NordSC” (the dataset of Nordén et al. 2019 but excluding flattened and hollow melanosomes) reporting higher values in all instances. The NordSC dataset is also more robust to correction for shrinkage. Overall, for almost every measure of model performance the “NordSC” dataset used in analyses Q2 and M2 performs noticeably better than the “LiNord” dataset. Interestingly, the fossil prediction probabilities for the fossil samples are marginally more confident for iridescent predictions using “NordSC” but are lower for grey predictions.
Table 3. Predictive model performance results. Self-test accuracy, LOOCV and Cohen’s Kappa all show performance on training data. Fossil prediction measures show the mean and range of all fossil sample probabilities. Shrinkage effect records the percentage of scaled values that resulted in a different classification to the unaltered fossil classification.
| |
Q1 |
Q2 |
M1 |
M2 |
M3 |
|
Self-test accuracy (%) |
77.8 |
83.5 |
70.4 |
79.4 |
85.0 |
|
LOOCV (%) |
74.1 |
81.8 |
64.8 |
76.5 |
82.8 |
|
Cohen’s Kappa (k = 5) |
0.65 |
0.71 |
0.56 |
0.65 |
0.68 |
|
Fossil prediction mean (%) |
85.1 |
95.3 |
77.0 |
79.8 |
79.8 |
|
Fossil prediction range (%) |
63.3–100.0 |
70.4–100.0 |
60.7–99.1 |
54.0–99.4 |
54.0–99.4 |
|
Shrinkage effect (%) |
6.7 |
0 |
16.7 |
6.7 |
6.7 |
Exclusion of hollow/flat melanosome data.—Including hollow and flat measurements in the “Nordén” dataset analysis M3 shows improved accuracy, LOOCV and Kappa, when compared against training data self-tests (see Table 3). Despite this, the fossil prediction probabilities are identical to those of analysis M2, which excludes the hollow and flat samples from the training data. This indicates that including hollow and flat data in an MLR provides no benefit to the colour prediction results for datasets consisting of entirely solid and cylindrical melanosomes. Including hollow and flat data is only suitable when hollow or flat melanosomes are recorded.
Furthermore, and as expected, the results of analysis Q3 (where hollow and flat data are included in a QDA) are different to every other analysis. They predict iridescence extremely confidently for every sample apart from 15c (see SOM: table S4). It is the only analysis where the application of QDA (Q3) and MLR (M3) to the same dataset produces inconsistent results across every fossil sample. This demonstrates the poorer results that arise when including hollow and flat sample data in a QDA analysis that cannot optimally use this information to discriminate the samples. We observe and caution that the inclusion of all variables when analysis is conducted using QDA comes at the expense of lowered accuracy and precision.
Colour category performance.—Iridescent (elongate) and brown (ovoid) melanosome results were predicted more accurately than other colour categories in a self-test (see Table 4) by both QDA and MLR. This is unsurprising, due to the more distinct morphology of these melanosomes when compared to black or grey eumelanosomes. In contrast, grey is predicted correctly for 52% of the data.
There is a notable reduction in the accuracy of predicting black using “NordSC”, with a decrease of 7.41% between QDA self-tests and a more substantial 18.52% between MLR self-tests (see Table 4). Predictions for the somewhat less distinct black melanosomes may be hampered by the imbalanced colour category composition after the expansion of the iridescent sample set by Nordén et al. (2019), although it does not appear to have an affect on grey, which are consistently 52% accurate on training self-tests regardless of model or dataset.
For the fossil data in our study, iridescence is predicted with very high confidence, whereas the prediction of grey is model dependent, averaging 99.7% in QDA (excluding 15c which is a notable outlier), but 66.6% in MLR. This pattern is irrespective of the dataset used and is interesting because both methods performed equally well on the training data; this difference in fossil colour category performance arises either from the nuances of the fossil data or from differences in the modelling approaches themselves.
Table 4. Accuracy (%) (self-test) of individual colour categories within each analysis.
| |
Q1 |
Q2 |
M1 |
M2 |
M3 |
|
black |
70.37 |
62.96 |
55.56 |
37.04 |
37.04 |
|
brown |
92.86 |
92.86 |
92.86 |
92.86 |
92.86 |
|
grey |
52.00 |
52.00 |
52.00 |
52.00 |
52.00 |
|
iridescent |
92.86 |
95.56 |
78.57 |
95.56 |
97.39 |
Discussion
Melanosomes preserved in Wulong bohaiensis DNHM D2933 have a morphology that suggest iridescent plumage within a Cretaceous juvenile microraptorine dromaeosaur. We have shown that while MLR allows for inclusion of a greater range of melanosomes involved in creating certain brighter iridescent nanostructures it comes at a cost to predictive accuracy to other classes of melanin-based colour, with the most noticeable effect on grey melanosomes in this study. Therefore, in the case of entirely solid cylindrical fossil melanosomes, QDA is recommended as the preferred method of inference. Self-test analyses show an accuracy of 83.5% for datasets comprising only solid and cylindrical melanosomes using QDA.
Colour reconstruction of Wulong bohaiensis DNHM D2933.—Based on our results we can reconstruct the plumage of Wulong bohaiensis DNHM D2933 as iridescent on its forelimb and hindlimb remiges (Fig. 4). This contributes a new instance of iridescent colouration amongst paravians, alongside Microraptor (Li et al. 2012), Caihong (Hu et al. 2018), Bohaiornis (Peteya et al. 2017) and recently Eoconfuciusornis (Pan et al. 2022), as well as the first evidence of iridescence in a juvenile dinosaur.
Apart from sample 15c, all other samples (when not iridescent) predicted as grey, unlike the non-iridescent feathers reconstructed in Microraptor and Caihong, which were mostly black. Sample 15c, which consist of fairly small and notably more ovoid melanosomes (Fig. 2), predicted as either grey with QDA or brown with MLR, but with low precision. Given that the samples predicted as grey are largely derived from the body contour feathers, it is possible that some grey results may represent sampling of proximal portions of contour feathers, which tend to be grey and downy (Nordén et al. 2019). Sampling was originally carried out with little attention to whether regions represented distal or proximal portions of a feather; this limitation is acknowledged. However, when sampling regions of the body composed of multiple overlapping feathers (distal regions above and proximal ones below), both layers are likely to conflate. We therefore consider the consistent predictions of grey colour from the body as being a robust result reflecting the expressed and visible colour.
The contrasting predictions for sample 15c might be an artefact of one of the limitations of palaeocolour reconstruction. Since the methods relies on classifying colour into distinct categories when in fact melanin based colours form a continuous spectrum, it will fail when a colour is intermediate. In the instance of a spectrum of colour present in one location, less distinct morphology is harder to categorise statistically. We can speculate that the small ovoid melanosomes in sample 15c represent a colour that is intermediate between grey and brown. This mixture of cryptic feathers combined with other showy iridescent areas could also relate to a transitional juvenal plumage or reflect proximo-distal variation in colour between the upper and exposed portion and the lower, downy portion.
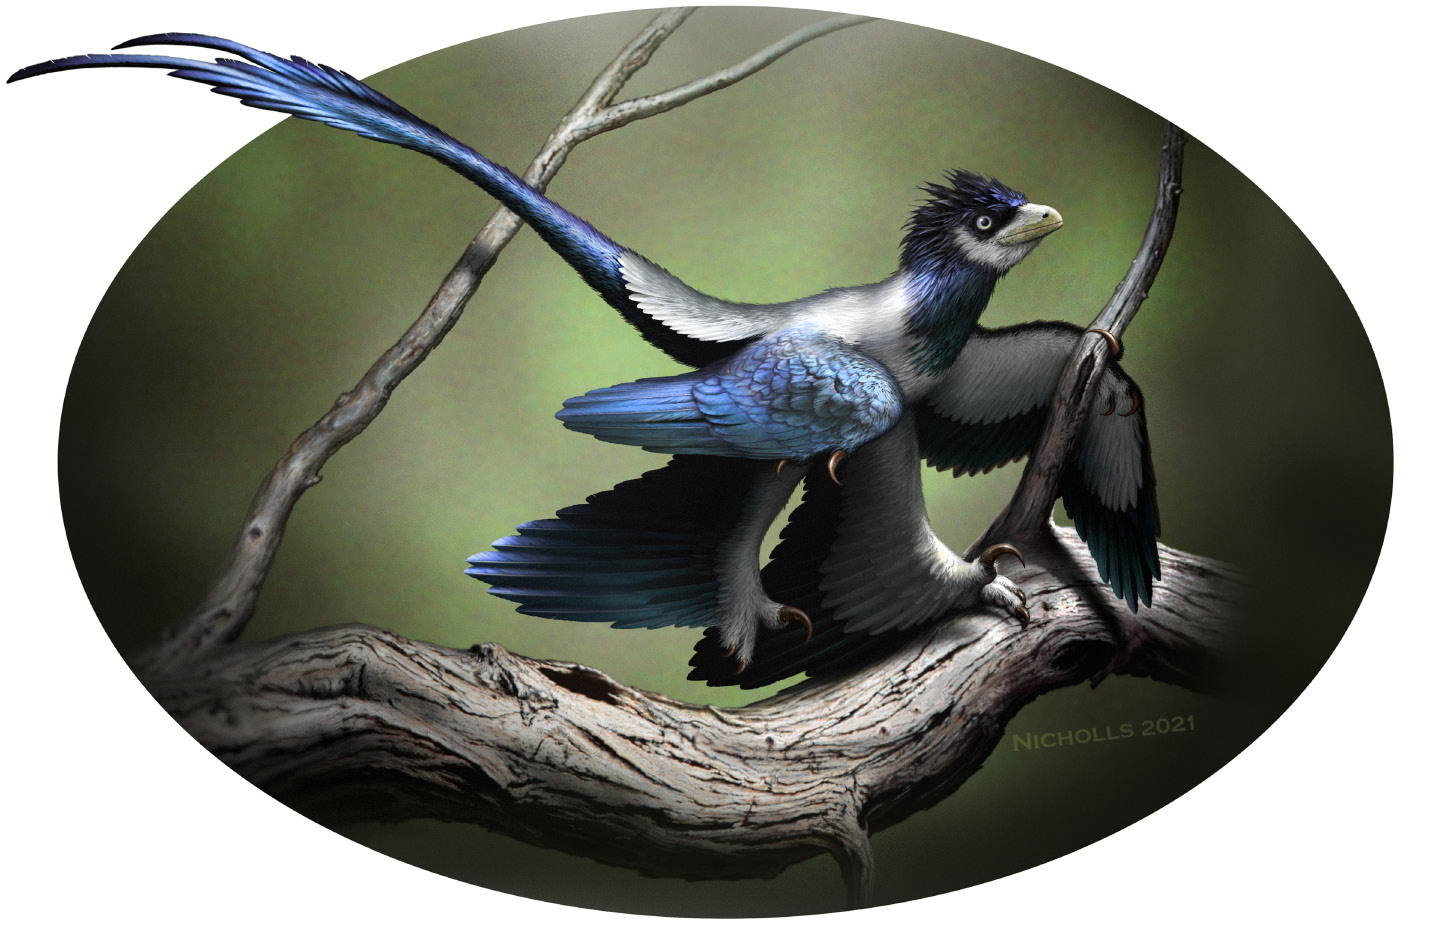
Fig. 4. Reconstruction of the dromaeosaurid dinosaur Wulong bohaiensis Poust, Gao, Varricchio, Wu, and Zhang, 2020 (DNHM D2933), from Shangheshou, Chaoyang, Liaoning, China, Early Cretaceous Jiufotang Formation with a minimum age of 120.3 Ma. This illustration broadly depicts iridescent plumage on the limbs and grey feathers on the body. It should be noted that the full extent of the iridescence has been extrapolated in the creation of this illustration, based on the evidence provided by a small but significant distribution of iridescent samples across several limbs of the fossil. Artwork by Robert Nicholls (Bob Nicholls Art).
Iridescence and feather function.—The presence of iridescent plumage, as reported here for Wulong bohaiensis DNHM D2933 and recognized in a handful of other non-avian paravians, is suggestive of a display and signalling function. Our study adds to growing evidence that pennaceous feathers in non-avian paravians served functions other than aerodynamics, and could have originated for purposes other than flying (Li et al. 2010), before being exapted as airfoils (e.g., Zelenitsky et al. 2012; Foth et al. 2014; Koschowitz et al. 2014; Brusatte 2017). However, another possibility is that the evolution of aerial modes of life in an ancestral maniraptoran facilitated by pennaceous feathers was associated with different behaviours and resulting signalling strategies. For example, increased display may be linked to a more arboreal lifestyle due to less predation pressure when concealed in a canopy and less accessible from a distance.
Feathers, of course, have multiple uses—as observed in modern birds using their feathers as both flying devices and display ornaments. As one example, many dabbling ducks feature iridescent specula on their secondaries (Eliason and Shawkey 2012). Whilst remaining important for flight these must play an important role in the life of a bird, perhaps as indicators of health (Legagneux et al. 2010). Studies have shown that iridescent specula have little impact on pairing success, however (Omland 1996). It may therefore be that such features are simply used as intraspecific indicators to aid identification during courtship, which may be important given how prone ducks are to cross-hybridise.
Due to sampling constraints, we are not able to precisely locate the exact position within the wing of every sample. Neither are we able to describe the full extent of iridescence on the wings of Wulong bohaiensis DNHM D2933, simply that it is present on at least three limbs, and in broadly different areas within each limb. Notably however, some iridescent samples (e.g., sample 6) represent remiges. This is not a common combination in modern birds. Indeed, remiges are often the opposite of flashy and iridescent in modern birds, with black tipped primaries commonly employed to better endure the abrasive wear that flight brings (Averill 1923). The range of possible iridescent wing plumage distributions seen in extant species including iridescent remiges (e.g., Amazonetta brasiliensis which has close to full iridescent wing coverage), moderate coverage of secondaries and greater/lesser coverts (e.g., Vanellus vanellus, Pica pica, and many hummingbirds) or more conservative wing bars (e.g., Garrulus glandarius and on dabbling ducks), should be considered when interpreting any future discoveries of fossilised iridescent melanosomes on wings. This may help further untangle the specific roles of iridescence in non-avian paravians.
It has already been suggested that the long tail feathers found on the Wulong bohaiensis DNHM D2933 specimen served a display function (Poust et al. 2020). The results of our study now show that perhaps there were two different, complementary, methods of display: iridescent plumage on limbs, and long tail feathers of unknown colouration. Although both features are known to be used for display in modern birds (Thomas 1997), they are not typically seen to fully develop until sexual maturity is reached. In larger, longer-lived birds (which are more comparable to the size of Wulong bohaiensis DNHM D2933) mature plumage can be delayed because they mate later on, e.g. some gulls only begin to mate after 5 years (Proctor and Lynch 1993). Therefore, as initially suggested by Poust et al. (2020), the presence of ornamental feathers on this juvenile specimen suggest that plumage may have developed at a different rate to most modern birds and indeed iridescence may occur in juvenile forms when used for intraspecific communication. Several birds engage in intraspecific signalling using iridescent signals, especially amongst corvids, in which both adults and subadults exhibit iridescence albeit sometimes less brightly expressed in the juveniles (Nam et al. 2016).
Ultimately, untangling why pennaceous feathers evolved in dinosaurs will require further colour reconstructions, particularly of species close to the point on the phylogeny where pennaceous feathers and wings developed, as well as biomechanical studies of the flight capabilities of these species. We therefore remain agnostic to whether pennaceous feathers primarily evolved for display or aerial locomotion, but note that since iridescence only occurs in barbules, which only evolved with a more complex pennaceous feather it must have been preceded by feathers having been driven to become more complex for other reasons than for creating iridescent display. We reiterate Mayr’s (2014) salient point that display feathers usually depart from a typical, vaned flight feather and how the forelimb and hindlimb rectrices across all non-avian paravians resemble functional aerodynamic foils more than any display structure known in modern birds.
Impact of choice of analytical method for colour prediction.—QDA consistently outperforms MLR across both datasets, providing more accurate and more confident predictions on both self-tests and the fossil data, whilst remaining in total agreement with all colour predictions of the potentially more robust MLRs (with the notable exception of sample 15c). We have established that both models predict iridescence with high overall confidence in the fossil samples. However, despite equal performance on grey training data, QDA also yielded high probabilities for prediction of grey results, whereas MLR is less certain, and this is irrespective of dataset used. Despite the ability of MLR to give optimal classifications for models including both continuous and categorical predictors, small group sizes for black, brown and grey may contribute to less accurate results, with our results suggesting a particular impact evident for grey samples. Fig. 5 illustrates one reason why predicting grey might be more difficult. For samples with an aspect ratio of approximately 2.5–3.5, it can be very difficult to predict the most likely colour category due to the less distinct and potentially conflating geometry. Several of the Wulong bohaiensis DNHM D2933 samples have an aspect ratio in this range (see SOM: table S3). The continued expansion of the extant melanosome dataset, with particular focus on non-iridescent melanosomes, might further strengthen this method in the future and improve MLR predictions.
We have also shown that the expanded dataset “NordSC” performs better on all self-tests. This is the dataset in which the expanded dataset of Nordén et al. (2019) is analysed with hollow and flat melanosomes excluded. There is a 9.2% (QDA) and 16.1% (MLR) increase in the value for Cohen’s Kappa. Cohen’s Kappa is arguably the strongest measure to interpret because the k-fold cross-validation used in its calculation splits the data into small subsets. This reduces potential prediction error from an outlier or biased data point, making it more robust than LOOCV (James et al. 2013).
Finally, as the results of analyses Q3 and M3 have shown, expanding the dataset to include hollow and flat iridescent melanosomes as in Nordén et al. (2019) is not appropriate or necessary when exclusively studying solid cylindrical melanosomes. It should always be used, however, when hollow or flat melanosomes are observed in a fossil.
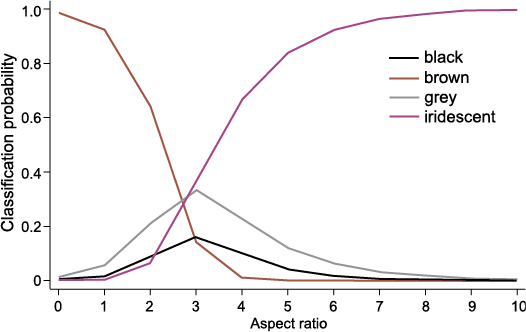
Fig. 5. Variation of probability with respect to the aspect ratio predictor variable (one of the two variables included in analysis M2). This plot shows that at aspect ratios of approximately 2.5–3.5, the probabilities of predicting any of the four possible colour categories are similar, and none are very likely. Several samples in Wulong bohaiensis (DNHM D2933) had an aspect ratio within this range.
Conclusions
In this study, we have established from specimen DNHM D2933 that the juvenile dromaeosaur Wulong bohaiensis had iridescent plumage on its limbs, and a grey body. It appears that more conspicuous signalling was widespread amongst the paravian dinosaurs, which may reflect shifts in ecology offered by arboreal lifestyles and pinnate feathers.
This study has also shown that QDA remains a useful and valid predictive approach to complement MLR when studying solid cylindrical fossil melanosomes. Future studies should evaluate melanosome morphology and potential hollowness and flatness to determine which dataset and predictive method to use. This may be facilitated from observing and identifying obliquely exposed melanosomes and/or broken ones and can be supplemented by methods such as FIB-SEM or TEM imaging.
Acknowledgements
SEM work was funded by a bursary awarded through the University of Edinburgh Moray Fund. Thanks are due to Zhang Yuqing (DNHM) for collecting the samples. Nicola Cayzer (University of Edinburgh, UK) provided expert advice in sample preparation and SEM imaging. Thank you to Ffion Robb and Kim Kean (both University of Edinburgh, UK) for their help in measuring melanosomes for the assessment of experimenter bias. Tim Croudace (University of Dundee, UK) was a source of valuable guidance for some of the statistical analysis and helped proofread several drafts of the manuscript. Thanks also to Fiann Smithwick (University of Bristol, UK) who soaked samples in acetone and provided images of samples 9 and 13, which had been measured at an earlier date to check melanosome preservation success. We are grateful to Ashley Poust (San Diego Natural History Museum, USA) for supplying detailed photographs of the specimen, and along with an anonymous referee, helpful comments that improved this manuscript in review.
References
Averill, C.K. 1923. Black Wing Tips. The Condor 25 (2): 57–59. Crossref
Babarović, F., Puttick, M.N., Zaher, M., Learmonth, E., Gallimore, E.-J., Smithwick, F.M., Mayr, G. and Vinther, J. 2019. Characterization of melanosomes involved in the production of non-iridescent structural feather colours and their detection in the fossil record. Journal of The Royal Society Interface 16 (155): 20180921. Crossref
Brown, C.M., Henderson, D.M., Vinther, J., Fletcher, I., Sistiaga, A., Herrera, J., and Summons, R.E. 2017. An exceptionally preserved three-dimensional armored dinosaur reveals insights into coloration and Cretaceous predator-prey dynamics. Current Biology 27: 2514–2521.e3. Crossref
Brusatte, S.L. 2017. A Mesozoic aviary. Science 355: 792–794. Crossref
Colleary, C., Dolocan, A., Gardner, J., Singh, S., Wuttke, M., Rabenstein, R., Habersetzer, J., Schaal, S., Feseha, M., Clemens, M., Jacobs, B.F., Currano, E.D., Jacobs, L.L., Sylvestersen, R.L., Gabbott, S.E., and Vinther, J. 2015. Chemical, experimental, and morphological evidence for diagenetically altered melanin in exceptionally preserved fossils. Proceedings of the National Academy of Sciences 112: 12592–12597. Crossref
Eliason, C.M. and Shawkey, M.D. 2012. A photonic heterostructure produces diverse iridescent colours in duck wing patches. Journal of The Royal Society Interface 9: 2279–2289. Crossref
Field, D.J., D’Alba, L., Vinther, J., Webb, S.M., Gearty, W., and Shawkey, M.D. 2013. Melanin concentration gradients in modern and fossil feathers. PLoS One 8 (3): e59451. Crossref
Foth, C., Tischlinger, H., and Rauhut, O.W.M. 2014. New specimen of Archaeopteryx provides insights into the evolution of pennaceous feathers. Nature 511: 79–82. Crossref
McGraw, K.J. 2006. Mechanics of melanin based coloration. In: G.E. Hill and K.J. McGraw (eds.), Bird Coloration, Volume 1: Mechanisms and Measurements, 243–294. Harvard University Press, Cambridge. Crossref
Hu, D., Clarke, J.A., Eliason, C.M., Qiu, R., Li, Q., Shawkey, M.D., Zhao, C., D’Alba, L., Jiang, J., and Xu, X. 2018. A bony-crested Jurassic dinosaur with evidence of iridescent plumage highlights complexity in early paravian evolution. Nature Communications 9 (1): 217. Crossref
James, G., Witten, D., Hastie, T., and Tibshirani, R. 2013. An Introduction to Statistical Learning: With Applications in R. 440 pp. Springer, New York. Crossref
Koschowitz, M.-C., Fischer, C., and Sander, M. 2014. Beyond the rainbow. Science 346: 416–418. Crossref
Landis, J.R. and Koch, G.G. 1977. The measurement of observer agreement for categorical data. Biometrics 33: 159–174. Crossref
Legagneux, P., Théry, M., Guillemain, M., Gomez, D., and Bretagnolle, V. 2010. Condition dependence of iridescent wing flash-marks in two species of dabbling ducks. Behavioural Processes 83: 324–330. Crossref
Li, Q., Gao, K.-Q., Meng, Q., Clarke, J.A., Shawkey, M.D., D’Alba, L., Pei, R., Ellison, M., Norell, M.A., and Vinther, J. 2012. Reconstruction of Microraptor and the Evolution of Iridescent Plumage. Science 335: 1215–1219. Crossref
Li, Q., Gao, K.-Q., Vinther, J., Shawkey, M.D., Clarke, J.A., D’Alba, L., Meng, Q., Briggs, D.E.G., and Prum, R.O. 2010. Plumage color patterns of an extinct dinosaur. Science 327: 1369–1372. Crossref
Liu, Y. and Simon, J.D. 2003. Isolation and biophysical studies of natural eumelanins: applications of imaging technologies and ultrafast spectroscopy. Pigment Cell Research 16: 606–618. Crossref
Mayr, G. 2014. On the origin of feathers. Science 346: 1466. Crossref
McNamara, M.E., Briggs, D.E.G., Orr, P.J., Field, D.J., and Zhengrong, W. 2013. Experimental maturation of feathers: implications for reconstructions of fossil feather colour. Biology Letters 9 (3): 20130184. Crossref
McNamara, M.E., Kaye, J.S., Benton, M.J., Orr, P.J., Rossi, V., Ito, S., and Wakamatsu, K. 2018. Non-integumentary melanosomes can bias reconstructions of the colours of fossil vertebrates. Nature Communications 9 (1): 2878. Crossref
Mehmetoglu, M. and Jakobsen, T.G. 2017. Applied Statistics Using Stata: A Guide for the Social Sciences. 376 pp. Sage Publishing, Los Angeles.
Nam, H.-Y., Lee, S.-I., Lee, J., Choi, C.-Y., and Choe, J.C. 2016. Multiple structural colors of the plumage reflect age, sex, and territory ownership in the Eurasian magpie Pica pica. Acta Ornithologica 51: 83–92. Crossref
Nordén, K.K., Faber, J.W., Babarović, F., Stubbs, T.L., Selly, T., Schiffbauer, J.D., Peharec Štefanić, P., Mayr, G., Smithwick, F.M., and Vinther, J. 2019. Melanosome diversity and convergence in the evolution of iridescent avian feathers—implications for paleocolor reconstruction. Evolution 73: 15–27. Crossref
Nordén, K.K., Eliason, C.M., and Stoddard, M.C. 2021. Evolution of brilliant iridescent feather nanostructures. Elife 10: e71179. Crossref
Omland, K.E. 1996. Female mallard mating preferences for multiple male ornaments. Behavioral Ecology and Sociobiology 39: 353–360. Crossref
Pan, Y., Li, Z., Wang, M., Zhao, T., Wang, X., and Zheng, X. 2022. Unambiguous evidence of brilliant iridescent feather color from hollow melanosomes in an Early Cretaceous bird. National Science Review 9 (2): nwab227. Crossref
Peteya, J.A., Clarke, J.A., Li, Q., Gao, K.-Q., and Shawkey, M.D. 2017. The plumage and colouration of an enantiornithine bird from the early Cretaceous of China. Palaeontology 60: 55–71. Crossref
Poust, A.W., Gao, C., Varricchio, D.J., Wu, J., and Zhang, F. 2020. A new microraptorine theropod from the Jehol Biota and growth in early dromaeosaurids. The Anatomical Record 303: 963–987. Crossref
Proctor, N.S. and Lynch, P.J. 1993. Manual of Ornithology: Avian Structure & Function. 108 pp. Yale University Press, New Haven.
Prota, G. 1988. Progress in the chemistry of melanins and related metabolites. Medicinal Research Reviews 8: 525–556. Crossref
Prum, R.O. 2006. Anatomy, physics, and evolution of structural colours. In: G.E. Hill and K.J. McGraw (eds.), Bird Coloration, Volume 1: Mechanisms and Measurements, 295–353. Harvard University Press, Cambridge. Crossref
Riley, P.A. 1997. Melanin. International Journal of Biochemistry and Cell Biology 29: 1235–1239. Crossref
Schneider, C.A., Rasband, W.S., and Eliceiri, K.W. 2012. NIH Image to ImageJ: 25 years of image analysis. Nature Methods 9: 671–675. Crossref
StataCorp 2019a. Stata Statistical Software: Release 16. StataCorp LLC, College Station.
StataCorp 2019b. Discriminant analysis > logistic. Stata 16 Multivariate Statistics Reference Manual. 7. Stata Press, College Station.
Stoddard, M.C. and Prum, R.O. 2008. Evolution of avian plumage color in a tetrahedral color space: a phylogenetic analysis of new world buntings. The American Naturalist 171: 755–776. Crossref
Stuart-Fox, D., Ospina-Rozo, L., Ng, L., and Franklin, A.M. 2021. The paradox of iridescent signals. Trends in Ecology & Evolution 36: 187–195. Crossref
Thomas, A.L.R. 1997. On the tails of birds. Bioscience 47 (4): 215–225. Crossref
Vinther, J. 2016. Fossil melanosomes or bacteria? A wealth of findings favours melanosomes. BioEssays 38: 220–225. Crossref
Vinther, J. 2020. Reconstructing vertebrate paleocolor. Annual Review of Earth and Planetary Sciences 48 (1): 345–375. Crossref
Vinther, J., Briggs, D.E.G., Clarke, J., Mayr, G., and Prum, R.O. 2009. Structural coloration in a feather from the Eocene Messel Oil Shale. Geological Society of America, Abstracts with Programs 41: 32.
Vinther, J., Briggs, D.E.G., Prum, R.O., and Vinodkumar, S. 2008. The colour of fossil feathers. Biology Letters 4: 522–525. Crossref
Vinther, J., Nicholls, R., Lautenschlager, S., Pittman, M., Kaye, T.G., Rayfield, E., Mayr, G., and Cuthill, I.C. 2016. 3D Camouflage in an Ornithischian dinosaur. Current Biology 26: 2456–2462. Crossref
Vitek, N.S., Vinther, J., Schiffbauer, J.D., Briggs, D.E.G., and Prum, R.O. 2013. Exceptional three-dimensional preservation and coloration of an originally iridescent fossil feather from the Middle Eocene Messel Oil Shale. Paläontologische Zeitschrift 87: 493–503. Crossref
Zelenitsky, D.K., Therrien, F., Erickson, G.M., DeBuhr, C.L., Kobayashi, Y., Eberth, D.A., and Hadfield, F. 2012. Feathered non-avian dinosaurs from North America provide insight into wing origins. Science 338: 510–514. Crossref
Acta Palaeontol. Pol. 68 (2): 213–225, 2023
https://doi.org/10.4202/app.01004.2022