

Morphological disparity of early ammonoids: A geometric morphometric approach to investigate conch geometry
NINON ALLAIRE, SAMUEL GINOT, KENNETH DE BAETS, DIETER KORN, NICOLAS GOUDEMAND, CLAUDE MONNET, and CATHERINE CR�NIER
Allaire, N., Ginot, S., De Baets, K., Korn, D., Goudemand, N., Monnet, C., and Cr�nier C. 2023. Morphological disparity of early ammonoids: A geometric morphometric approach to investigate conch geometry. Acta Palaeontologica Polonica 68 (2): 193�212.
Fossils of Devonian ammonoids are abundant and well-preserved in the Anti-Atlas of Morocco; as such they provide an invaluable record of regional morphological disparity changes (diversity of shapes) that characterise the first steps of ammonoid evolution. However, they were rarely analysed quantitatively with respect to their morphological spectrum. Here, we investigated the morphological disparity of the Early�Middle Devonian ammonoids of the Moroccan Anti-Atlas by analysing the shape of their whorl profile. A geometric morphometric approach based on the acquisition of outline semilandmark coordinates was used to analyse the whorl profiles. For comparison, morphometric ratios based on classical conch measurements were also analysed to investigate the overall conch geometry. Several standard disparity estimators were computed to measure different aspects of morphological disparity fluctuations through time. It appears that a major increase in disparity occurred throughout the Early Devonian, followed by fluctuating disparity during the Middle Devonian constituting a general decreasing trend. Only the end-Eifelian Ka��k Event shows a significant decrease in disparity. Thus, the ammonoids explored the range of possible shapes fairly quickly during their initial radiation; however, we found no evidence for an early burst of shape diversity (i.e., the rise does not exceed the expectations given diversity). Nevertheless, correlation tests between diversity and disparity time series support that they are partially decoupled. The highly resolved biozone record highlights that the increase in disparity began earlier than the increase in diversity that characterises the late Emsian.
Key words: Ammonoidea, conch geometry, geometric morphometrics, macroevolution, morphological disparity, Devonian.
Ninon Allaire [ninon.allaire@gmail.com; ORCID: https://orcid.org/0000-0002-8003-1792 ], Consejo Nacional de Investigaciones Cient�ficas y T�cnicas (CONICET), Centro de Investigaciones en Ciencias de la Tierra (CICTERRA), C�rdoba, Argentina (current address); Univ. Lille, CNRS, UMR 8198 � Evo-Eco-Paleo, F-59000 Lille, France; Institut de G�nomique Fonctionnelle de Lyon, ENS de Lyon, CNRS, UMR 5242, France; Geozentrum Nordbayern, Friedrich-Alexander Universit�t Erlangen-N�rnberg, 91054 Erlangen, Germany.
Samuel Ginot [ginotsam@gmail.com; ORCID: https://orcid.org/0000-0003-0060-9660 ], Institute of Evolutionary Bio��logy and Ecology, University of Bonn, An der Immenburg 1, 53121 Bonn, Germany (current address); Institut de G�nomique Fonctionnelle de Lyon, ENS de Lyon, CNRS, UMR 5242, France; Institut des Sciences de l�Evolution de Montpellier, Universit� de Montpellier, CRNS, IRD, EPHE, UMR 5554, France.
Kenneth De Baets [k.de-baets@uw.edu.pl; ORCID: https://orcid.org/0000-0002-1651-321X ], Institute of Evolutio�nary Biology, Faculty of Biology, Biological and Chemical Research Centre, University of Warsaw, Poland (current address); Geozentrum Nordbayern, Friedrich-Alexander Universit�t Erlangen-N�rnberg (FAU), 91054 Erlangen, Germany.
Dieter Korn [dieter.korn@mfn.berlin; ORCID: https://orcid.org/0000-0003-1104-6939 ], Museum f�r Naturkunde, Leibniz-Institut f�r Evolutions- und Biodiversit�tsforschung, Invalidenstra�e 43, 10115 Berlin, Germany.
Nicolas Goudemand [nicolas.goudemand@ens-lyon.fr; ORCID: https://orcid.org/0000-0002-2956-5852 ], Institut de G�nomique Fonctionnelle de Lyon, ENS de Lyon, CNRS, UMR 5242, France.
Claude Monnet [claude.monnet@univ-lille.fr; ORCID: https://orcid.org/0000-0002-0899-8392 ] and Catherine Cr�nier [catherine.cronier@univ-lille.fr; ORCID: https://orcid.org/0000-0002-7606-0822 ], Univ. Lille, CNRS, UMR 8198 � Evo-Eco-Paleo, F-59000 Lille, France.
Received 14 October 2022, accepted 24 May 2023, available online 28 June 2023.
Copyright � 2023 N. Allaire et al. This is an open-access article distributed under the terms of the Creative Commons Attribution License (for details please see http://creativecommons.org/licenses/by/4.0/), which permits unrestricted use, distribution, and reproduction in any medium, provided the original author and source are credited.
Introduction
Ammonoids are extinct cephalopods with an external coiled conch; they originated in the Early Devonian (Schindewolf 1933; Erben 1953, 1960, 1964, 1965, 1966; Becker and House 1994; Klug et al. 2008a; De Baets et al. 2013; Becker et al. 2019). They descended from the Bactritida, which are thought to root in the latest Silurian or earliest Devonian Orthocerida (Erben 1966; Kr�ger and Mapes 2007; Klug et al. 2015b). Thanks to their numerous morphological characters, ammonoids constitute an invaluable fossil record for documenting macroevolutionary patterns (e.g., Kennedy and Cobban 1976; Teichert�1986; House 1988; Brayard et al. 2009; Monnet et al. 2011, 2015; Korn and Klug 2012; Brosse et al. 2013; Tendler et al. 2015).
The initial radiation of ammonoids took place in a context of environmental conditions that were repeatedly affected by more or less severe crises (Klug et al. 2010). Several global events, usually associated with significant environmental changes, have been recorded by the study of Devonian rocks and fossils. Some of these events severely impacted marine life and led to extinction phases (for a review of Devonian global events and crises, see Walliser 1984, 1996; House 1985, 1996a, 2002; Becker et al. 2016). House (1989), Saunders et al. (2008), Korn and Klug (2012) and Korn et al. (2015) documented changes in the taxonomic diversity of Palaeozoic ammonoids. For the time interval studied here (Early�Middle Devonian), global reductions in ammonoid diversity were recorded for the late Emsian (Early Devonian) Daleje Event, the end-Eifelian (Middle Devonian) Ka��k Event and the Givetian Taghanic Event (Middle Devonian; Korn and Klug 2012).
Taxonomic diversity trends can be compared to disparity (i.e., the diversity of phenotypes) trends; they provide a robust framework for discussing evolutionary processes and understanding biotic crises (Roy and Foote 1997). To achieve that, multivariate ordination methods allow to quantify morphological disparity and provide a convenient way to study the variation of shapes without considering the taxonomic or phylogenetic context (Foote 1997; Nardin et al. 2005). They have been successfully applied to various cephalopod groups, such as ammonoids (e.g., Dommergues et al. 1996; Simon et al. 2010; Korn and Klug 2012; Hoffmann et al. 2019), belemnites (Dera et al. 2016; N�tscher et al. 2021) and modern coleoids (Neige 2003; Hoffmann et al. 2021).
Classic methods involving linear measurements of the conch, as the so-called Raupian parameters (Raup and Michelson 1965; Raup 1966, 1967; Korn and Klug 2003), enable the calculation of morphometric conch properties. This traditional approach allows for the quantification of the entire conch geometry; however, it does not allow us to take into account all the morphological features that characterise the morphology of the conch, such as the degree of whorl overlap, the curvature of the flanks and the presence of grooves and keels (Korn and Klug 2012). Therefore, a geometric morphometric approach applied to the whorl profiles represents an alternative to complement the understanding of the conch shape evolution (Korn and Klug 2012). The shape of the whorl profile determines two dimensions of the space that accommodated the animal�s soft body (but not the length of the body chamber) (Klug et al. 2015a; Bucher et al. 1996; Guex 2003). The preparation of cross sections of ammonoid conchs is considered a classic method for studying this group and provides an immense amount of biometric data (Reyment and Kennedy 1991; Korn and Klug 2003, 2012). The shape of the whorl profile is highly variable in ammonoids and it is therefore used in various studies investigating their changes in morphological disparity (e.g., Simon et al. 2010; Korn and Klug 2012; Klein and Korn 2014; Mor�n-Alfonso et al. 2021).
Several studies have already examined the morphological evolution of Devonian ammonoids, mostly on a global level (Korn and Klug 2003, 2012; Monnet et al. 2011; De Baets et al. 2012; Korn et al. 2015; Whalen et al. 2020). Through the Devonian, rapid coiling trends from uncoiled/straight ancestors to ammonoids with coiled embryonic as well as post-embryonic conchs have been documented (House 1996a; Korn and Klug 2003; Klug and Korn 2004; Klug et al. 2008a; Monnet et al. 2011; De Baets et al. 2012, 2013; Naglik et al. 2019). Korn and Klug (2012) and Korn et al. (2015) documented the fluctuations in morphological disparity through the Devonian using a standard morphometric method based on a modified version of the Raupian parameters (Korn 2010). They documented a major increase in morphological disparity during the Emsian (Early Devonian), followed by a decrease from the Eifelian to the Givetian (Middle Devonian). Whalen et al. (2020) documented the global fluctuations of ammonoid disparity through the Palaeozoic based on conch morphometric data; in this study they used ammonoids as a model taxon to test for the prevalence of early bursts (i.e., accumulation of morphological disparity in excess of taxonomic richness; see Simpson 1944; Foote 1994, 1997; Hughes et al. 2013; Benton et al. 2014). They also captured this pattern of rapidly increasing disparity through the Emsian; however, they found no evidence for an early burst: After being corrected for species richness, the disparity of Emsian ammonoids does not exceed the null expectation given the concomitant increase in species richness (Whalen et al. 2020).
Furthermore, concerning the extinction events occurring through the studied time interval (Early and Middle Devonian), Korn and Klug (2012) and Korn et al. (2015) reported that only the end-Eifelian Ka��k event was marked by a significant decrease in disparity; they found that changes in diversity and disparity were usually decoupled (Korn and Klug 2012; Korn et al. 2015). However, the results of Whalen et al. (2020) suggest that the majority of Palaeozoic ammonoid species-level morphological disparity could be explained by species richness alone, contrary to these previous works.
Korn and Klug (2012) were the only ones to investigate the morphological disparity of Devonian ammonoids by analysing the shape of the whorl profile using a Fourier analysis and a multivariate analysis; they described the evolution of the morphospace occupation at substage resolution. However, changes through time were not quantified using disparity indices. With their loosely coiled conchs (i.e., advolute/evolute conchs without whorl overlap), the early Emsian ammonoids occupied a very restricted part of the morphospace (Korn and Klug 2012). Then, a shift occurred and new shapes appeared through the late Emsian and the Middle Devonian, with a trend towards more involute conchs with increasing whorl overlap degrees (Korn and Klug 2012).
The purpose of our study is to accurately quantify the morphological disparity of ammonoids from their origination in the early Emsian (Early Devonian) to the end of the Givetian (Middle Devonian), by investigating the shape of the whorl profile using a geometric morphometric approach and a broad range of disparity metrics. The novelty of our study also resides in the higher temporal resolution (biozone level), in the updated dataset including new data from all recent publications documenting early ammonoids from Morocco and from specimens prepared and drawn (DK). In addition, our study allows to test, at the regional scale, the global findings of Whalen et al. (2020) concerning the relationship between morphological disparity and taxonomic richness and the occurrence of an early burst pattern. In this context, the highly resolved Moroccan biozone record enables to highlight changes that cannot be seen using a lower time resolution (i.e., substage or stage resolution).
Abbreviations.�CWI, conch width index; IZR, imprint zone rate; PC, principal components; SoR, sum of ranges; SoV, sum of variances; UWI, umbilical width index; WER, whorl expansion rate; WW, whorl width index. See also SOM 1 (Supplementary Online Material at http://app.pan.pl/SOM/app68-Allaire_etal_SOM.pdf).
Material and methods
Data compilation.�Our study is based on the fossil record of ammonoids from the Anti-Atlas of Morocco (Fig. 1), an area that is well-known for its abundant and well-preserved Devonian ammonoid assemblages. In the last decades, many papers documenting Early and Middle Devonian ammonoids from Morocco were published (Becker and House 2000; Klug et al. 2000, 2008a; Klug 2001a, b, 2002a, b, 2017; Becker et al. 2004, 2013, 2018, 2019; Becker 2007; Bockwinkel et al. 2009, 2013, 2015, 2017; De Baets et al. 2010; Aboussalam and Becker 2011; Ebbighausen et al. 2011). These studies provide a comprehensive and valuable record of taxonomic diversity and morphological disparity of ammonoids through time. Furthermore, working in this one area allows for the collection of data with a consistent species-level taxonomic framework and with a precise timescale based on the Moroccan ammonoid biozonation (Fig. 2). This time interval of around 22.3 million years (Walker et al. 2018) has been subdivided into 30 biozones based on ammonoids (Klug 2002b; Aboussalam and Becker 2011; Bockwinkel et al. 2015; Becker et al. 2019). In order to synthesise the more general changes in disparity observed at the biozone resolution and to visualise global trends, the studied time interval is divided into seven timeslices, which are also used as a time scale (Fig. 2).
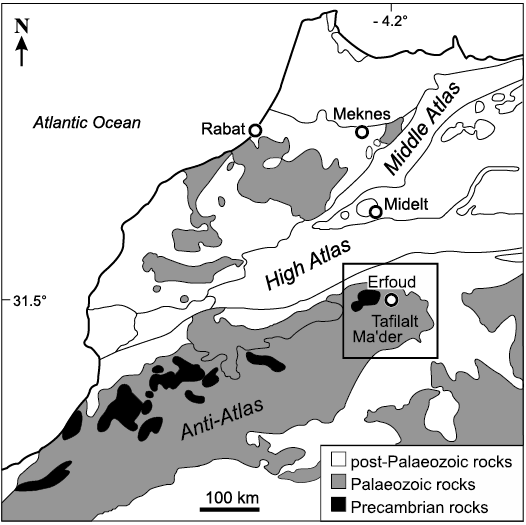
Fig. 1. Simplified geological map of Morocco (modified from Klug 2002b). The square shows the area where Early and Middle Devonian ammonoids are reported (Tafilalt and Ma�der basins).
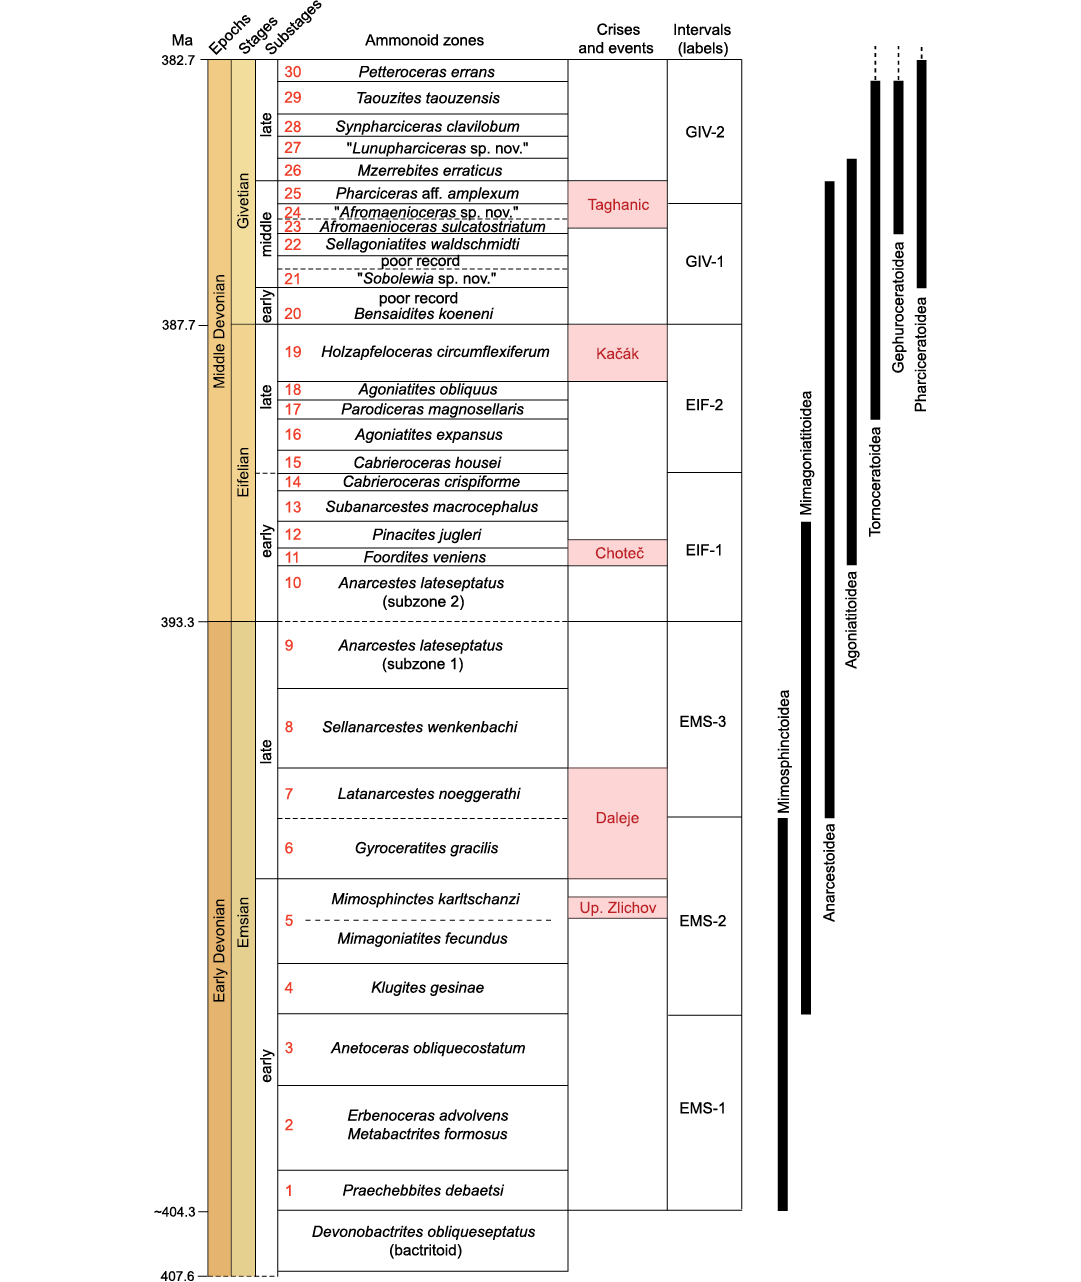
Fig. 2. Stratigraphic scheme for the Early and Middle Devonian of the Anti-Atlas of Morocco, showing the distribution of superfamilies through time. Ammonoid biozonation from (Klug 2002a; Aboussalam and Becker 2011; Bockwinkel et al. 2015; Becker et al. 2019). Absolute ages from the Geological Time Scale v. 5.0 (Walker et al. 2018). �Sobolewia sp. nov.� and �Afromaenioceras sp. nov� have been introduced by Becker et al. (2004), and �Lunupharciceras sp. nov.� by Aboussalam and Becker (2011); these new taxa have not yet been formally described but they are mentioned in several studies where they are used to establish the biozonation (e.g., Becker et al. 2004; Aboussalam and Becker 2011).
The dataset analysed here is a compilation of drawings of whorl profiles (Fig. 3) from specimens illustrated in the literature (Chlup�� and Turek 1983; Korn 1999; Klug 2001a, 2002b; Korn and Klug 2002; Bockwinkel et al. 2009, 2013, 2015, 2017; De Baets et al. 2010; Aboussalam and Becker 2011; Ebbighausen et al. 2011; Becker et al. 2013, 2019) and from unpublished material (39 whorl profiles belonging to 20 species). The dataset includes 127 Early and Middle Devonian ammonoid species that were documented from the Anti-Atlas (dataset available as SOM 2 and 3). Most taxa (~70%) are represented by several drawings of the whorl profile, which correspond to ontogenetic stages of individual specimens. The decision to select only one specimen per species is guided by the aim of focusing only on the interspecific variation and not intraspecific variation (e.g., De Baets et al. 2013; Hoffmann et al. 2019). Some of the species could not be included in our analysis because their stratigraphic distribution is unclear or because complete whorl profile outlines were not available.
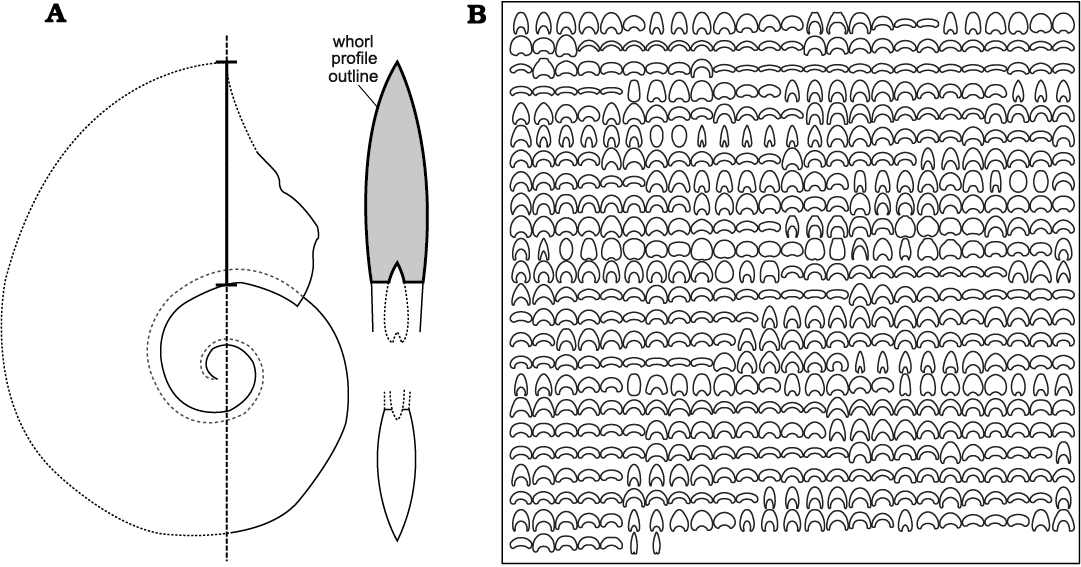
Fig. 3. Ammonoid morphology and dataset. A. Morphology of an ammonoid; as an example, the outline of the whorl profile taken at the maximum conch diameter is highlighted by a thick black line (modified from De Baets et al. 2010). B. Dataset analysed here; compilation of drawings of whorl profile outlines corresponding to Early and Middle Devonian ammonoids from Morocco.
Independently, the conch geometry was also analysed on the basis of classical linear measurements of the conch (SOM�1; for details, see Korn 2010). For most species (~75%), the analysed measurements (see SOM 4) correspond to the same specimens from which the whorl profiles were analysed. From these measurements (SOM 1), five morphometric ratios were calculated (see Korn 2010): Conch width index (CWI = ww/dm1), umbilical width index (UWI = uw/dm1), whorl expansion rate (WER = (dm1/dm2)2), whorl width index (WWI = ww/wh) and imprint zone rate (IZR = (wh-ah)/wh).
Geometric morphometrics.�In our study, the shape of the whorl profile is quantified using geometric morphometrics with the acquisition of semilandmark coordinates on the outline (for a general overview of geometric morphometrics, see Adams et al. 2004, 2013; Zelditch et al. 2012). All the functions used here to perform geometric morphometric analysis are from the R package Momocs (version 1.4.0; Bonhomme et al. 2014). Drawings of whorl profiles are automatically digitised into a series of 200 curvilinear equally-�spaced points on the outline, the semilandmarks (Gunz and Mitteroecker 2013), by using the function �coo_interpolate�. The standardisation of semilandmark data to correct the size/scale, position/translation, and orientation/rotation of whorl profiles is performed as follow: (i) translation effect is removed by centering the outlines (i.e., placing all outlines around their centroid, which is the average point of all semilandmarks) using the function �coo_center�; (ii) coordinates of each outline are scaled by their centroid size using the function �coo_scale�; (iii) the starting point of each outline (i.e., point located at the intersection between the outline and the line passing by the centroid with an angle of ?/2) is defined using the functions �coo_intersect_angle� and �coo_slide�. Then, superimposed coordinates are modeled into harmonic coefficients with an elliptical Fourier analysis (EFA) (Kuhl and Giardina 1982; Ferson et al. 1985; Crampton 1995; Lestrel 1997; Haines and Crampton 2000; Bonhomme et al. 2014) computed with the function �efourier�. The number of harmonics to be used for the subsequent analyses is selected by default in the function to represent at least 99% of the cumulative Fourier harmonic power, in our case this was achieved with 6 harmonics. Our scripts are available online (https://github.com/sginot/Ammonoids_disparity).
Morphospaces and disparity metrics.�To study the shape changes and to quantify the morphological disparity in time series, the obtained Fourier coefficients are analysed using a principal component analysis; this creates a multidimensional empirical morphospace (Foote 1991; Budd 2021). In macroevolutionary approaches, various disparity indices have been used to assess the changes in morphological disparity based on morphospace occupation (Foote 1991, 1993; Wills et al. 1994; Ciampaglio et al. 2001; Wills 2001; Guillerme et al. 2020). The computation of different types of disparity indices (i.e., size, density and position) is essential to catch different aspects of morphological disparity fluctuations through time (Guillerme et al. 2020; Hopkins 2022). Here, morphological disparity changes over time are analysed using five indices: sum of ranges (SoR) and convex hull area (i.e., size-based disparity indices); sum of variances (SoV) and mean squared Euclidean distance from centroid (i.e., density-based disparity indices); and average displacement (i.e., position-based disparity index). Confidence intervals are computed by randomly resampling with replacement points in the morphospace (1000 iterations) and extracting the 2.5 and 97.5 percentiles of the distribution (Foote 1991). The partial morphological disparity (i.e., sum of mean squared Euclidean distance from centroid per superfamilies) is computed using the method of Foote (1993). Disparity indices are calculated for each of the seven studied intervals constituting the Early and Middle Devonian, as well as for each of the 30 biozones (Fig. 2). To compute disparity indices, we produced our own custom code (available at https://github.com/sginot/Ammonoids_disparity) based on formulas from Foote (1993), Wills et al. (1994), Wills (2001) and Guillerme et al. (2020). All analyses are calculated using the scientific environment R (version 3.3.0, R Core Team 2016).
In order to compare traditional morphometrics based on linear measurements of ammonoid conchs to geometric morphometrics, the five conch morphometry ratios are ordinated using a principal component analysis to produce another morphospace, which is quantified similarly to the EFA-based morphospace (see disparity indices above).
In addition, for the two datasets, we applied the model of Whalen et al. (2020) to investigate the relationship between disparity and diversity, and to test the occurrence of an early burst pattern. This approach allows us to compare the measured disparity (estimated using the convex hull area calculated for PC1 and PC2) with the expected disparity corrected for species richness computed by applying the null model of Whalen et al. (2020). This null distribution of disparity values is basically computed from iterated shuffling of the morphospace, which maintains the number of points for each time bin, but modifies the corresponding points by randomly assigning real data values to different taxa. For details, see the original article and our custom code.
Results
Morphospace and morphological changes.�The two first principal components for the whorl section profiles explain 95.7% of the total variance (PC1 = 67.3%; PC2 = 28.4%; Fig. 4). Along the first axis, the shape variation is associated with the degree of whorl compression, which corresponds to the relative width of the whorl profile compared to its height. The distribution of the whorl profiles along PC1 covaries with the whorl width index (WWI; see SOM 5). Low PC1 values represent more compressed whorl profiles (whorl higher than wide, low WWI); towards high PC1 values, the whorl profiles are increasingly depressed (whorl wider than high, high WWI) (Fig. 4, SOM 5). Along the second axis, shape variation is related to the degree of whorl overlap. The distribution of the whorl profiles along PC2 covaries with the imprint zone rate (IZR; see SOM 5). Low PC2 values represent a lower overlap (more evolute conchs, low IZR); towards high PC2 values, the degree of overlap is increasing (more involute conchs, high IZR) (Fig. 4, SOM�5). In summary, morphological gradients can be seen along PC1 and PC2, respectively, from compressed to depressed whorl profiles (PC1), with a very low to very high degree of overlap (PC2).
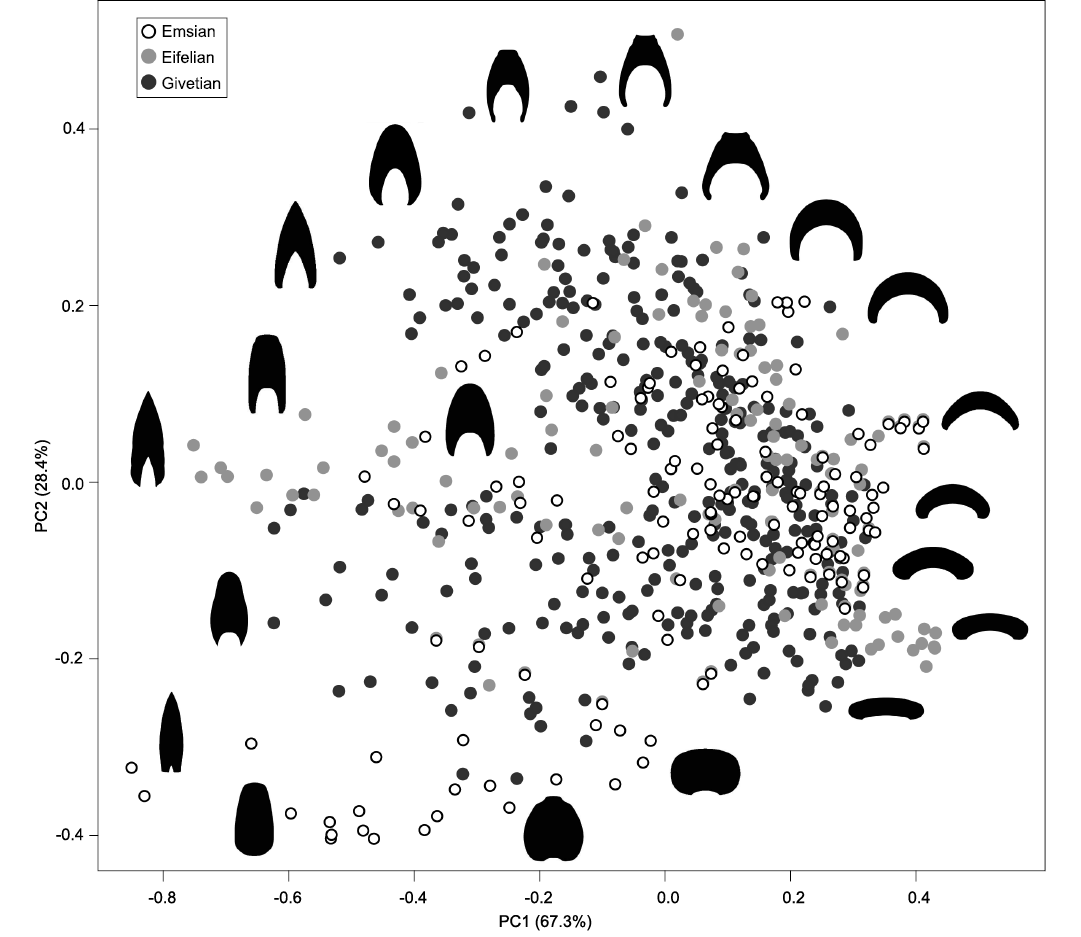
Fig. 4. Morphospace occupation observed for the Early and Middle Devonian, based on the analysis of the whorl profiles, with representative examples of shapes. The first two axes explain 95.7% of the variance.
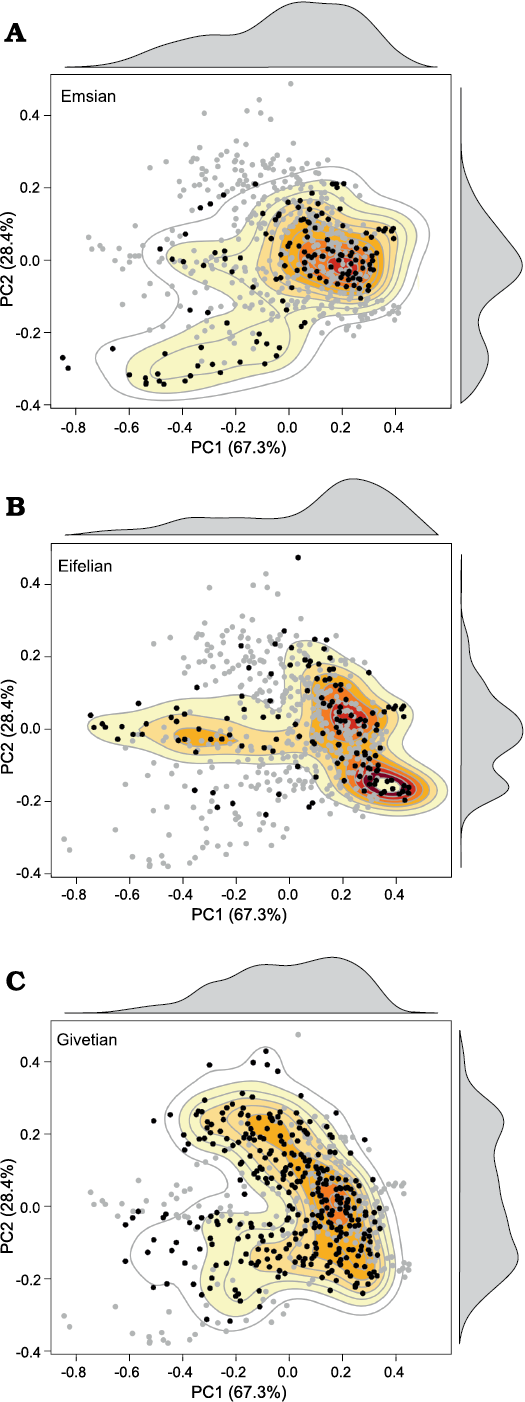
Fig. 5. Diagrams showing the morphospace occupation observed for the three stages constituting the Early and Middle Devonian (A�C), with level contours and density curves; based on the analysis of the whorl profiles. The grey dots correspond to the data recorded for the entire studied time interval (Early and Middle Devonian); the black dots refer to the data recorded for each of the studied stage (respectively, Emsian, Eifelian, and Givetian). The colours refer to the density of the data in the morphospace; the red-yellow-white gradient indicates the decreasing density of occupied areas. Compare also with density curves (in grey) above and to the right of the diagrams.
Considering the Emsian as a whole, the occupied morphospace already shows a wide range of morphologies, from very compressed to very depressed, with a degree of overlap from absent (gyroconic and advolute conchs) to moderate (subinvolute conchs) (Figs. 4, 5). However, the morphospace occupation is rather low in the first Emsian interval (Fig.�6: EMS-1, SOM 6: biozones 1�3), which is only produced by the ancestral ammonoid superfamily Mimosphinctoidea. The species of this superfamily show a very small range of morphologies (Fig. 6), usually with a compressed whorl profile and without whorl overlap (gyroconic to advolute conchs). During the second Emsian interval (Fig. 6: EMS-2, SOM 6: biozones 4�6), the morphospace occupation increased, caused by the emergence of the Mimagoniatitoidea, which are characterised by a wider morphological spectrum. Their diversification led to an expansion of morphospace to both higher and lower PC1 values (more compressed/more depressed whorl profiles), and towards slightly higher PC2 values (higher overlapping degree). The last Emsian interval (Fig. 6: EMS-3, SOM 6: biozones 7�9) records a significant increase in morphospace occupation. While the Mimosphinctoidea disappeared, the morphological range of the Mimagoniatitoidea increased and the Anarcestoidea appeared with their wide broad morphological spectrum (Fig. 6).
During the Eifelian, a large part of the total morphospace was occupied; even after the disappearance of the most compressed early Emsian forms, leaving the bottom-left corner of the morphospace unoccupied (Figs. 4, 5). The first Eifelian interval (Fig. 6: EIF-1, SOM 7: biozones 10�14) shows an expansion of the morphospace towards lower PC1 scores (more compressed conchs), caused by the emergence of the Agoniatitoidea, which mainly explored the middle left part of the morphospace. This means that new shapes with very compressed whorl profiles and a higher degree of overlap appeared (Figs. 4�6). Very involute forms characterised by a very high overlap degree, causing a horseshoe-shaped whorl profile, appeared within the Agoniatitoidea (top-most part of the morphospace; Fig. 6). During the second Eifelian interval (Fig. 6: EIF-2, SOM 7: biozones 15�19), morphospace occupation became more restricted with the extinction of the Mimagoniatitoidea. The origination of the Tornoceratoidea did not lead to any changes in the morphospace; they plot in the same area with some species of the Agoniatitoidea and the Anarcestoidea (Fig. 6).
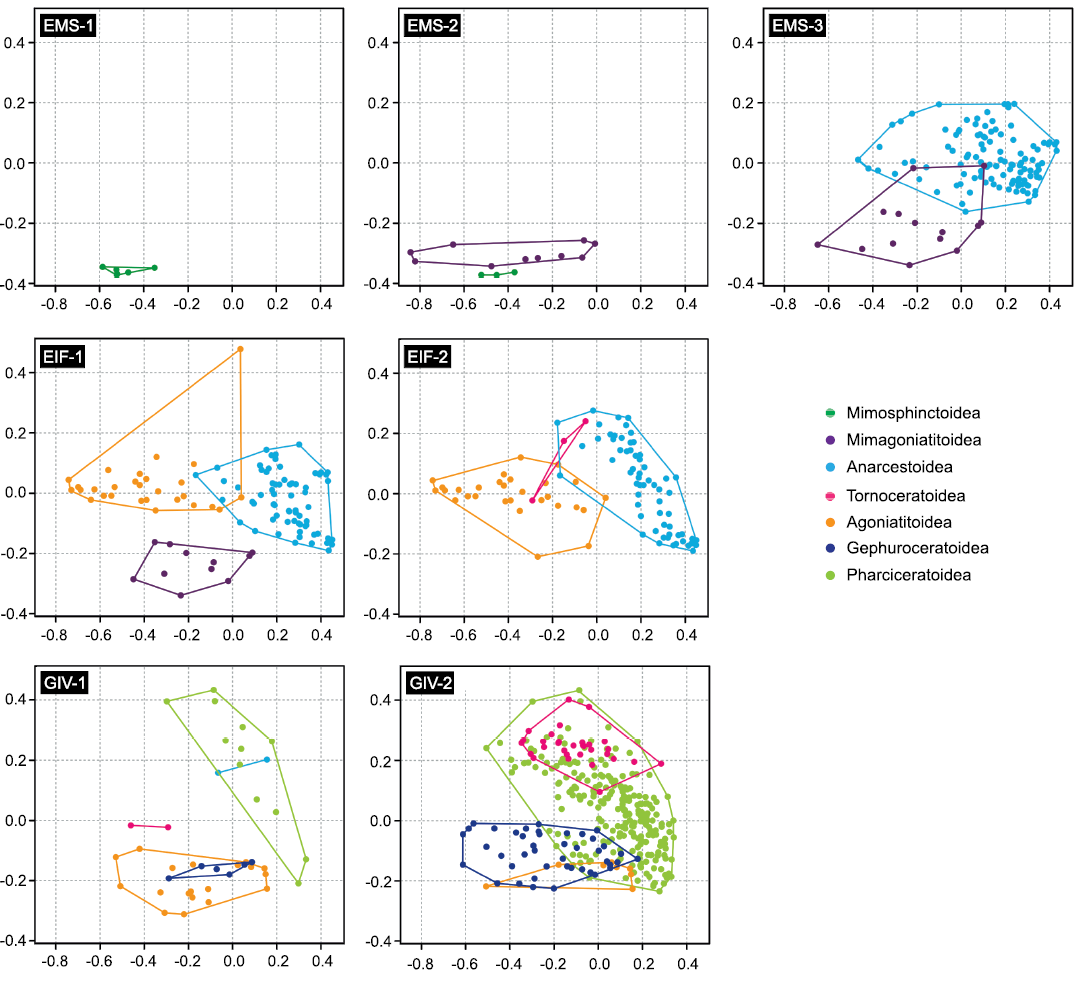
Fig. 6. Evolution of the morphospace occupation through the seven intervals constituting the Early and Middle Devonian, showing the distribution of ammonoid superfamilies; based on the analysis of the whorl profiles (on each diagram, the horizontal axis corresponds to PC1 and the vertical axis to PC2). See Fig. 2 for interval labels.
During the Givetian, the density of documented shapes in the morphospace increased significantly towards high PC2 scores (Fig. 5), highlighting the diversification of forms characterised by a higher degree of overlap (Fig. 4). With the disappearance of the most compressed forms of the Agoniatitoidea, the middle left-most part of the morphospace became empty (Figs. 4�6), while new forms characterised by more depressed whorl profiles diversified (expansion of the distribution towards lower PC1 scores; Fig. 6). The most depressed forms that were present during the Eifelian disappeared with the extinction of the Anarcestoidea; however, they are partially replaced by the Pharciceratoidea, which occupied a large part of the morphospace during the Givetian (Fig. 6: intervals GIV-1 and GIV-2). The Pharciceratoidea emerged in the first Givetian interval (Fig. 6: GIV-1, SOM�8: biozones 20�24), where they were already characterised by a wide range of morphologies, particularly in the degree of whorl overlap (Fig. 6). In addition, the new superfamily Gephuroceratoidea appeared; they are located in the same area as the Agoniatitoidea, but possessed a smaller range of morphology (Fig. 6). The Tornoceratoidea still occupied a restricted part in the morphospace where they cluster in the central area. During the second Givetian interval (Fig.�6: GIV-2, SOM 8: biozones 25�30), the Pharci�ceratoidea distribution generally expanded towards lower PC1 values, due to the presence of more compressed forms. The Tornoceratoidea diversified and occupied a larger part of the morphospace by expanding their distribution towards higher PC1 and PC2 values (Fig.�6). While the area occupied by the Agoniatitoidea decreased, the area occupied by the Gephuroceratoidea expanded and they showed a relatively large range of morphologies.
In summary, a progressive trend towards a higher overlapping degree is observed in the ammonoids from the Emsian to the Givetian (Figs. 4, 5). During the three stages, the density is relatively high towards high PC1 values (0.2�0.4), and towards moderate to low PC2 values (-0.2�0.0) (Fig. 5); this trend underlines the dominance of moderately depressed whorl profiles with a moderate degree of overlap (average morphology in terms of compression and overlap).
Morphological disparity trends.�The squared Euclidean dis�tance and the SoV (density-based disparity indices; Figs. 7B,�8B) show a long increasing trend from the early Emsian to the late Eifelian, followed by a slow decrease until the late Givetian where moderate disparity values are recorded.
The sum of ranges (i.e., size-based disparity indices) also records a progressive increase from the Emsian to the Eifelian, with very high values being reached in the first Eifelian interval. Then the disparity significantly decreased and reached moderate values in the first Givetian interval, to finally increase in the second Givetian interval to reach a level slightly lower than the Eifelian maximum (Fig. 8A).
The position based disparity index (average displacement = average distance from centre; Fig. 8C) records high values during the two first Emsian intervals (EMS-1 and EMS-2), then the values decreased significantly and remained relatively low through the Eifelian and Givetian (intervals EMS-3 to GIV-2). This trend reflects the morphospace occupation change occurring through the late Emsian: with the appearance of new conch shapes the ammonoids started to explore the central part of the morphospace (Fig.�6). In other words, the early Emsian ancestral shapes do not constitute an average morphology from which the diversification occurred in all directions; we rather have an oriented diversification towards positive values of PC1 and PC2 (see Fig. 6).
In summary, in terms of density and size, a global rise in disparity is recorded from the Emsian to the Eifelian, followed by a decreasing trend occurring from the Eifelian to the Givetian (Figs. 7B, C, 8A, B). Variations at the biozone resolution show the same global trends (Figs. 9B, C, 10A, B). The relatively high disparity recorded in the last Emsian interval (Figs. 7, 8) results in part from the ammonoid species occurring in the Sellanarcestes wenkenbachi Zone (biozone 8; Figs. 9, 10), where a large area of the morphospace is occupied (SOM 6). The peak in the first Eifelian interval mainly results from the disparity recorded in the Foordites veniens and Cabrieroceras crispiforme zones (biozones 11 and 14; Figs. 7B, C, 8A, B, 9B, C, 10A, B, SOM 7). During the Givetian, the highest levels of disparity are recorded in late Givetian biozones (Figs. 9, 10, SOM 8).
Some peaks result from the co-occurrence of superfamilies with different morphologies (e.g., Anarcestoidea and Agoniatitoidea during the Eifelian; Agoniatitoidea, Gephuroceratoidea and Pharciceratoidea during the Givetian; Figs. 6, 7, 9), while others are associated with the predominance of one superfamily with an important morphological variation (e.g., Mimagoniatitoidea during the second Emsian interval; Figs. 6, 7, 9).
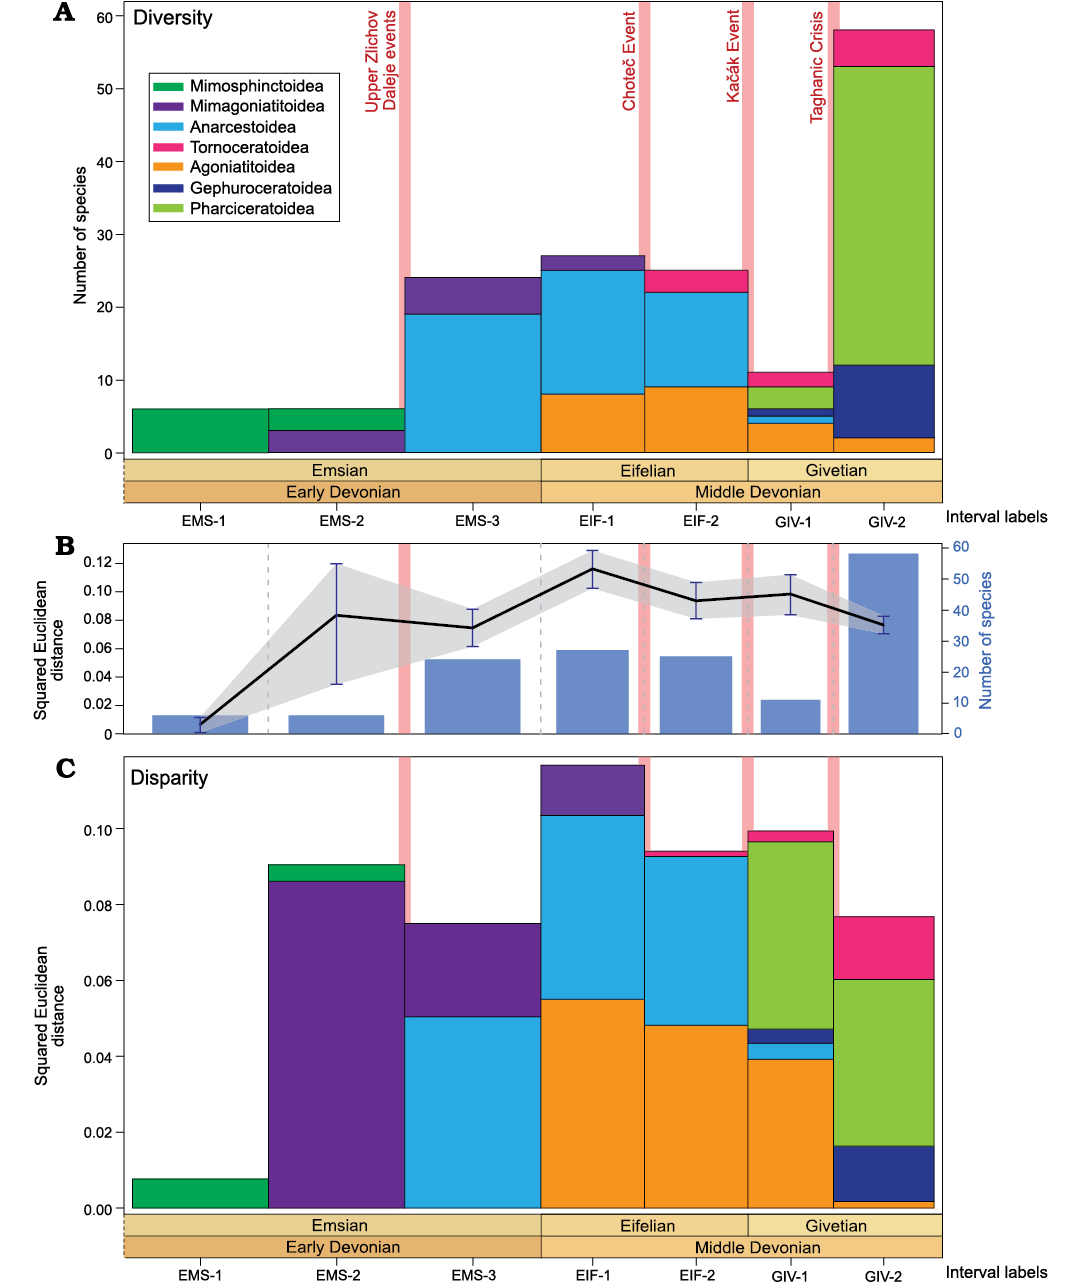
Fig. 7. Evolution of the relative contribution of ammonoid superfamilies to diversity and disparity (mean squared Euclidean distance to the centroid) through the Early and Middle Devonian; based on the analysis of the whorl profiles. A. Relative contribution of ammonoid superfamilies to diversity (sampled-in-bin). B. Fluctuations of the mean squared Euclidean distance to the centroid (black line with grey area showing the confidence intervals computed after 1000 bootstraps) and sampled-in-bin diversity (blue bars). C. Relative contribution of ammonoid superfamilies to disparity (mean squared Euclidean distance to the centroid). See Fig. 2 for interval labels.
Early burst pattern and correlation between disparity and diversity.�To test for the occurrence of an early burst of shape diversity, we applied the approach proposed by Whalen et al. (2020). This approach allows to compare the measured disparity estimated using the convex hull area computed for PC1 and PC2, with the expected variations of this index calculated considering the number of species in each bins (i.e., null model; Fig. 11). The measured values of this disparity estimator show similar variations as the SoR (Figs. 8A, 10A, 11), since they both constitute size-based disparity indices. Despite the rapid increase in disparity recorded through the Emsian, the results do not suggest any evidence for an early burst: The disparity of Emsian ammonoids from Morocco does not exceed the null expectation given the concomitant increase in taxonomic diversity (Fig.�11). It is in fact generally lower than expected considering a null hypothesis of random appearance of new morphologies in the morphospace.
Correlation tests between the disparity indices and the number of species (diversity) were assessed using Pearson�s approach (Haining 1991; Pearson 1896); the data were detrended using the method of Graeme T. Lloyd (https://www.graemetlloyd.com/methgd.html) before testing correlations (results of the correlations tests are available in SOM 9). At the interval resolution (N = 7), the correlation tests fail to find significant correlation between species disparity and species diversity for all indices (all p-values >0.05; see SOM�9). At the biozone resolution (N = 30), the size-based disparity indices (i.e., sum of ranges and convex hull area) show significant correlations with the number of species (p-values ?0.010; see SOM 9); while for the other indices (i.e., sum of variances, squared Euclidean distance and average displacement) the correlation tests fail to find a significant correlation with diversity (all p-values >0.05; see SOM 9).
Impacts of Early and Middle Devonian events.�The Upper Zl�chov Event (late early Emsian) is associated with a global minor transgression and with the spreading of hypoxic conditions (Garc�a-Alcalde 1997; Becker and Aboussalam 2011; Ferrova et al. 2012, 2013; Aboussalam et al. 2015). In Morocco, this event correlates with moderate disparity values and low taxonomic richness (Figs. 9, 10).
The Daleje Event (early late Emsian) corresponds to global sea level rise (House 1985, 2002; Klug 2002a; Ferrova et al. 2012, 2013; Aboussalam et al. 2015). Although the last representatives of the Mimosphinctoidea became extinct during this global transgressive event, diversity increased with the emergence of the Anarcestoidea (Figs. 9, 10). The size-based indices (i.e., sum of ranges and convex hull area, Figs. 10, 11) record a significant increase in disparity. The density-based disparity estimators (i.e., sum of variances and squared Euclidean distance) also show a slight but not significant increase. The average displacement decrease considerably and significantly through this time interval (Fig. 10C), reflecting the important change in morphospace occupation (SOM 6).
The Chote� Event (early Eifelian) is associated with a pulse of eutrophication and with an important turnover observed in many groups of organisms (Chlup�� and Kukal 1986, 1988). Impressive evidence of sudden flooding associated with anoxic facies was documented in the Anti-Atlas of Morocco (Becker and House 1994, 2000; Klug 2002a; Becker and Aboussalam 2013). In this time interval, the taxonomic richness is rather moderate. The disparity is relatively high in terms of size and density, but low in terms of position; no significant changes are recorded (Figs. 9�11).
The Ka��k Event (latest Eifelian) is a global extinction event (major marine faunal turnover) considered to be caused by climate change (House 1996b, 2002; Suttner et al. 2017). An occurrence of black shales associated with widespread hypoxic/anoxic conditions was documented (Suttner et al. 2017). The species diversity of the Moroccan ammonoids decreased drastically after the Ka��k events. In terms of morphological disparity fluctuations, the size-based indices record a significant decrease after the Ka��k Event (Figs. 10A, 11B); the density-based indices also show a decrease, but very slight and not significant (Figs. 9B, 10B). The morphospace occupation become restricted after the Ka��k Event (compare the two last Eifelian biozones, Agoniatites obliquus and Holzpfeloceras circumflexiferum zones, with the first Givetian one, Bensaidites koeneni Zone, SOM 7, 8). Interestingly, the decrease in disparity appears less sharp than the decrease in diversity.
The Taghanic Event (middle�late Givetian) corresponds to a multi-phased global crisis that led to major turnover in many groups of organisms (House 2002; Aboussalam and Becker 2011; Turnau 2014; Maillet et al. 2015; Narkiewicz et al. 2016). Like other events, it is associated with sudden climate changes including greenhouse overheating pulses and sea level fluctuations (Aboussalam and Becker 2011; Zambito et al. 2012). In the Anti-Atlas, no significant changes are recorded in both diversity and disparity of ammonoids; both remain rather stable during this time interval (Figs. 9�11).
Discussion
The major pattern highlighted by the geometric analysis of ammonoid whorl profiles is a rapid increase in the range of whorl profile disparity in early ammonoid evolution, reaching a stabilisation in the late Emsian to early Eifelian (i.e., see size and density disparity metrics; Figs. 7B, 8A, B, 9B, 10A, B, 11). This might be related to the rapid morphological evolution from loosely coiled or advolute conchs to those with increasingly overlapping whorls (Klug and Korn 2004; De Baets et al. 2012, 2013). This is consistent with the variations of the position-based disparity estimator; a shift is visible between the Emsian and the rest of the studied time interval (Figs. 8C, 10C). This trend towards a higher degree of whorl overlap continued throughout the Givetian, where the involute forms with high whorl overlap are more diverse (Fig. 5).
The morphospace based on the conch morphometry ratios (SOM 10) also highlights that ammonoids already displayed a wide range of morphologies in the Emsian; this also shows a trend towards a higher degree of whorl overlap from the Early to the Middle Devonian (i.e., exploration of the bottom-left part of the morphospace through the Middle Devonian corresponding to the appearance of more involute conch with a higher degree of overlap, SOM 10). Comparing the disparity based on whorl profile and conch morphometry ratios, respectively, the same general trends are recorded (Figs. 8, 11, SOM 11, 12). At the interval resolution, the size and density-based disparity estimators show a rapidly increasing disparity through the Early Devonian followed by a moderate and relatively progressive decrease through the Middle Devonian (Figs. 8A, B, 11A, SOM 11A, B, 12); the position-based disparity estimator shows high values in the two first Emsian intervals, then the values decrease significantly and stay low during the Middle Devonian (Fig.�8C, SOM 11C). Despite these similar general trends, however, differences can be recognised: regarding the size-based disparity indices, the conch morphometry ratio disparity had an earlier maximum (late Emsian) than the whorl profile disparity (early Eifelian) (compare the variations of the sum of ranges and convex hull area for the whorl profiles and conch morphometry ratios, respectively; Figs. 8A, 11A, SOM 11A, 12). The Agoniatitoidea that emerged through the early Emsian are characterised by a wide range of whorl profile shapes, while range in terms of conch morphometry ratios (overall shape of the conch) is more restricted. With its extreme shape, Mimotornoceras djemeli (represented by the topmost dot in the morphospace, see interval EIF-1, Fig.�6), contributes clearly to the high disparity values recorded in the first Eifelian interval (Fig. 8).
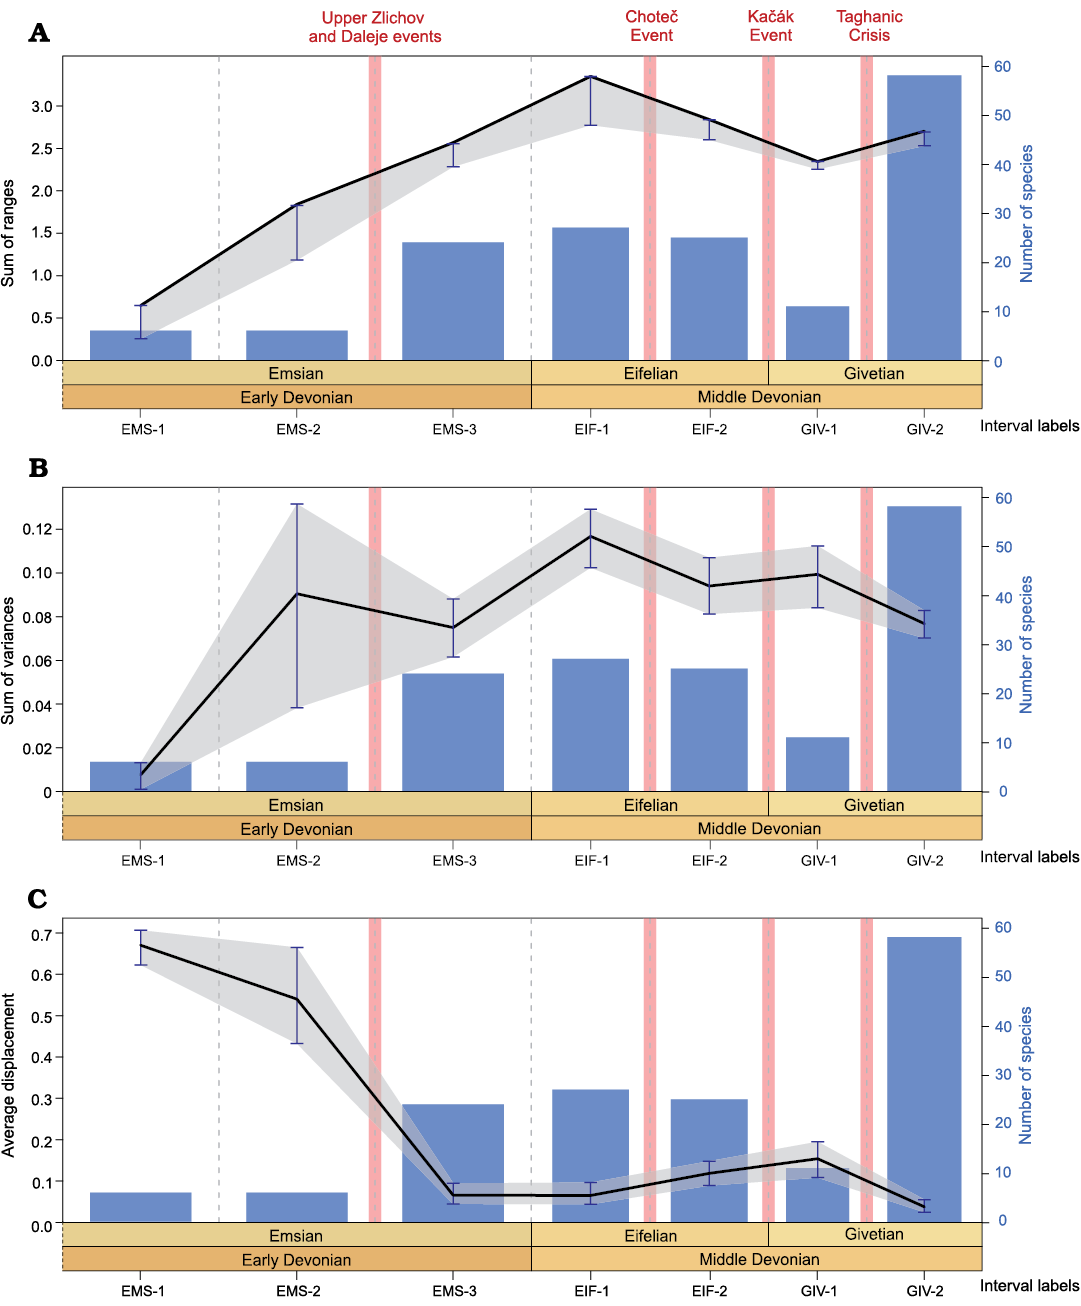
Fig. 8. Disparity and diversity fluctuations through the Early and Middle Devonian; based on the analysis of the whorl profiles. A. Sum of ranges (black line with grey area showing the confidence intervals) and sampled-in-bin diversity (blue bars). B. Sum of variances (black line with grey area showing the confidence intervals) and sampled-in-bin diversity (blue bars). C. Average displacement (black line with grey area showing the confidence intervals) and sampled-in-bin diversity (blue bars). Confidence intervals (error bars) are computed after 1000 bootstraps. See Fig. 2 for interval labels.
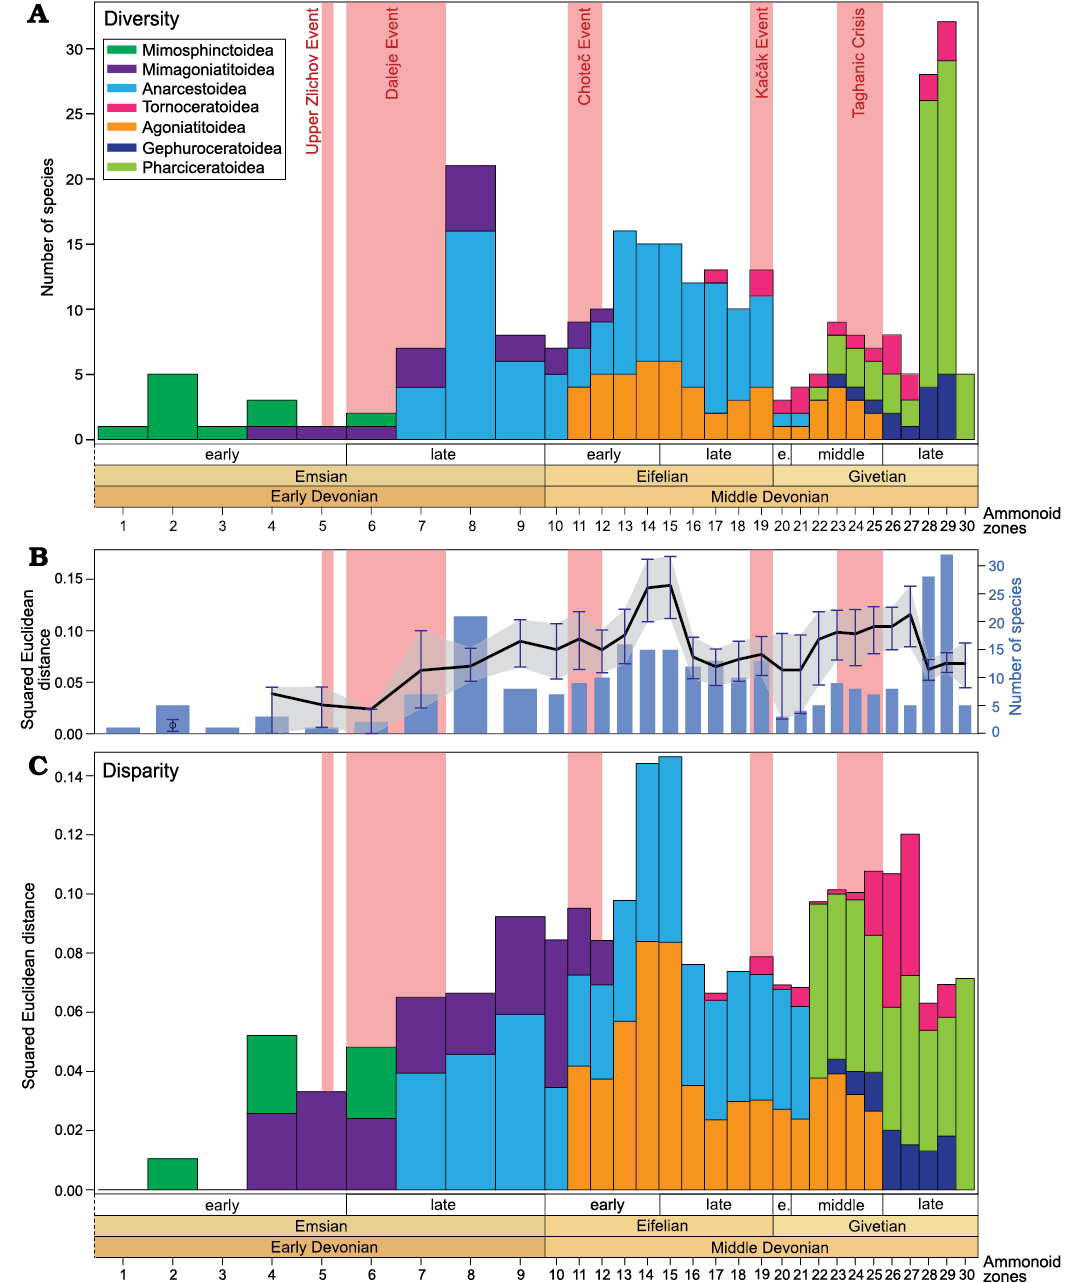
Fig. 9. Evolution of the relative contribution of ammonoid superfamilies to diversity and disparity (mean squared Euclidean distance to the centroid) through the Early and Middle Devonian ammonoid zones (biozones numbered from 1 to 30, see Fig. 2); based on the analysis of the whorl profiles. A. Relative contribution of ammonoid superfamilies to diversity (sampled-in-bin). B. Fluctuations of the mean squared Euclidean distance to the centroid (black line with grey area showing the confidence intervals computed after 1000 bootstraps) and sampled-in-bin diversity (blue bars). C. Relative contribution of ammonoid superfamilies to disparity (mean squared Euclidean distance to the centroid).
In ammonoids, the loosely coiled conch constitutes the plesiomorphic state of morphology, since they are interpreted to have descended from bactritoid ancestors with straight conical or slightly curved conchs (Schindewolf 1933; Erben 1964; Korn 2001; Klug and Korn 2004; Kr�ger and Mapes 2007; Klug et al. 2015b; Cichowolski and Rust�n 2017; Naglik et al. 2019). De Baets et al. (2012) documented the simultaneous increase in coiling of the inner whorls and the disappearance of the umbilical window in several Early Devonian ammonoid lineages. These trends, as well as the trend towards a higher degree of whorl overlap in the adult stage, may have affected the swimming capabilities and fecundity in ammonoids (Klug and Korn 2004; De Baets et al. 2012). The repeated coiling trends might be a response to increased predatory pressure as proposed for various molluscs groups (e.g., N�tzel and Fr�da 2003; Kr�ger 2005; De Baets et al. 2012, 2013; Klug et al. 2017; Dzik 2020). During the Devonian, various predatory groups capable of preying on ammonoids were already well established (Whalen and Briggs 2018; Ferr�n and Donoghue 2022). The ammonoid conch geometry can be interpreted as the result of tradeoffs between different functional ecological tasks (e.g., hydrodynamics, economy of shell material, shell growth, compactness) (Tendler et al. 2015, see also Hebdon et al. 2022). The loosely coiled conch is considered as an optimised morphology for an economy of shell material (Tendler et al. 2015). However, they are mechanically weaker and hydrodynamically less favourable; they can be crushed more easily by predators than tightly coiled conchs (Brett and Walker 2002; N�tzel and Fr�da 2003; Kr�ger 2005; Wagner and Erwin 2006; Klug 2007; De Baets et al. 2012). Following this idea, this trend towards increased coiling of the conch was usually interpreted as the result of adaptative pressures coupled with improved hydrodynamics. This allows for a higher swimming velocity and improved manoeuvrability (Chamberlain 1976, 1981; Klug 2001a; Korn and Klug 2003; Klug et al. 2008a, b, 2016; Monnet et al. 2011; De Baets et al. 2013; Frey et al. 2014; Naglik et al. 2015; Tendler et al. 2015), providing an advantage to escape from predators. The diversification of vertebrate nektonic predators, including fishes, and the escalation of their swimming capabilities has been demonstrated to be more complex and gradual (Whalen and Briggs 2018; Andreev et al. 2022; Ferr�n and Donoghue 2022; Friedman 2022; Zhu et al. 2022) than previously understood (Klug et al. 2010, 2017). Nevertheless, various or repeated pulses of increase in coiling may have occurred in conjunction with radiation pulses of active predators (Kr�ger 2005). But other factors might be involved; increased coiling also correlates with increasing fecundity as well as decreasing embryo size, leading to an increase in reproductive rates (Klug 2001a, 2007; De Baets et al. 2012, 2013, 2015; compare Ritterbush et al. 2014). It appears likely that tighter coiling enhanced swimming and reproductive capabilities of these cephalopods. However, the radiation of nekton might have been more smeared out (Whalen and Briggs 2018, and Ferr�n and Donoghue 2022) and this evolutionary tendency towards more involute conchs could be also driven by competition in a diversity-saturated habitat where abundant planktonic food was available (e.g., Klug et al. 2010). It has at least been plausibly suggested that many ammonoids, compared to other pelagic groups, had a more passive life history with reduced mobility potential and reduced capacities for larger prey items based on their small estimated buccal masses and hyponomes (Walton and Korn 2018).
The changes in conch morphology of early ammonoids occurred simultaneously and convergently (or even in parallel) in various taxa (Korn and Klug 2003; Kr�ger 2005; Monnet et al. 2011, 2015; De Baets et al. 2013; Klug et al. 2015b; Naglik et al. 2019). This supports the hypothesis that the evolutionary trend towards more densely coiled conchs was ecologically driven. In any case, the change in coiling modified the syn-vivo shell orientation in such way that the aperture became horizontally aligned with the centre of mass, which would have enabled the ammonoids to higher swimming speeds (Saunders and Shapiro 1986; Klug 2001a; Klug et al. 2008a; Hoffmann et al. 2015; Naglik et al. 2015).
Independent of these adaptative explanations, morphological changes of the early ammonoid conchs might also have resulted from a random walk biased by left-wall effects (i.e., constructional constraints; Monnet et al. 2011, 2015). In that case, the hypotheses about ecological trends mentioned above just describe side-effects of other trends; but all these explanations may also have worked in concert.
Regarding disparity patterns, Korn and Klug (2012) documented an important increase through the Emsian followed by a sharp decrease during the Eifelian and Givetian. This result was based on linear (conch) measurements. Our geometric morphometric analysis of whorl profiles also captures this general pattern of decreasing disparity through the Middle Devonian, but the drop down is not that sharp and we can see that the disparity has rather decreased moderately and progressively after the rapid increase observed during the Emsian (see the fluctuations at the interval resolution, Figs. 7, 8). The significant increase in disparity occurring during the Emsian is recorded based on both conch morphometry ratios and whorl profiles (Fig. 8, SOM�11); therefore, in the initial phase of their evolutionary history, the ammonoids rather quickly explored the range of available shapes. Interestingly, we can see that this increase began even earlier than the increase in taxonomic diversity that characterises the late Emsian (Figs. 7�10). The results of Whalen et al. (2020) show high disparity levels in the evolution of the late Emsian and earliest Givetian ammonoids. Our results corroborate the high disparity reached in the late Emsian, but do not show any disparity pike in the earliest Givetian (Fig. 10); for the Moroccan ammonoids the disparity rather increased later in the late Givetian, and also reached a high level in the Eifelian (Fig. 10).
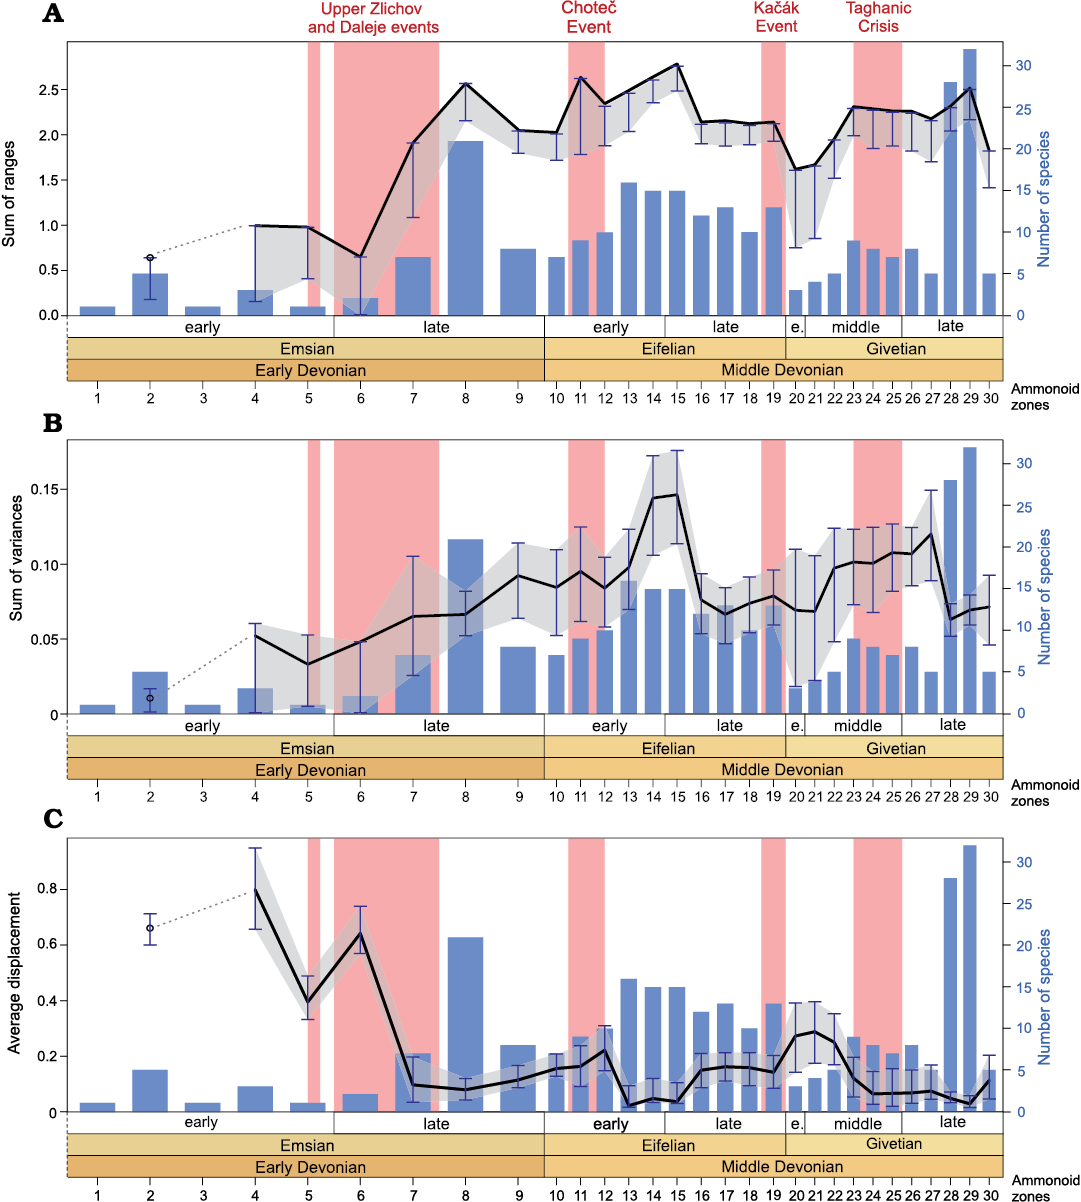
Fig. 10. Disparity and diversity fluctuations through the Early and Middle Devonian ammonoid zones (biozones numbered from 1 to 30, see Fig. 2); based on the analysis of the whorl profiles. A. Sum of ranges (black line with grey area showing the confidence intervals) and sampled-in-bin diversity (blue bars). B. Sum of variances (black line with grey area showing the confidence intervals) and sampled-in-bin diversity (blue bars). C. Average displacement (black line with grey area showing the confidence intervals) and sampled-in-bin diversity (blue bars). Confidence intervals (error bars) are computed after 1000 bootstraps.
Our results confirm that the ammonoids reached a high disparity early in their evolution. However, according to the results obtained by applying the test of Whalen et al. (2020) for early burst evolution, this rise does not exceed the expectations given diversity (for the whorl profiles as well as for the conch morphometry ratios; Fig. 11, SOM 12). In fact, disparity is consistently lower than the values expected under the null distribution. This may, however, also suggest that this test is overly conservative. Indeed, this might be explained by the fact that the null distribution is produced under the assumption that any (really sampled) morphology may appear for any species in the morphospace, no matter what morphologies were present in ancestral/related taxa. Therefore, morphologies differing completely from their putative ancestral stock of species are allowed to appear, potentially producing an overestimate of disparity, when compared for example to a Brownian motion. Under Brownian motion, the test of Whalen et al. (2020) would have to be modified to account for the fact that new morphologies are less likely to appear further away from standing morphologies. Such modification would certainly decrease the distribution of disparity values, and render the test less conservative. Notwithstanding these criticisms, as it stands, the results do not allow us to state firmly that the early increase in disparity observed in ammonoids corresponds to an early burst pattern or not. Although the �early high disparity� model has been documented for many animal clades (Foote 1994, 1997; Erwin 2007; Hughes et al. 2013; Benton et al. 2014; Oyston et al. 2015; Wagner 2018), it seems that this trend is not the predominant pattern throughout the Phanerozoic and that is even rather rare in ammonoids (Whalen et al. 2020). The development of a less conservative test for this pattern, although outside of the scope of the current paper, might help solve this open debate on the prevalence of early burst patterns through evolution.
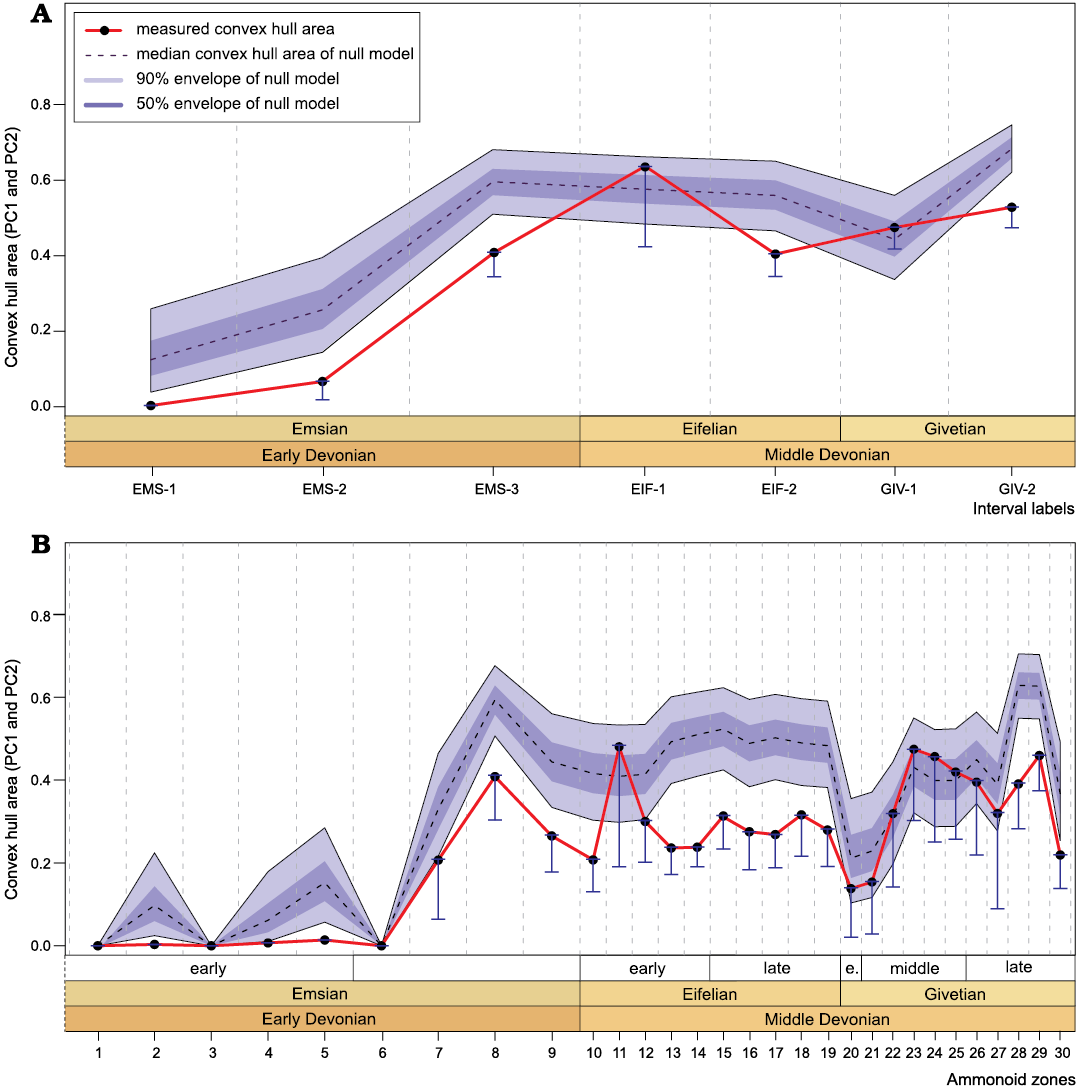
Fig. 11. Variations of the convex hull area computed for PC1 and PC2, based on the analysis of the whorl profiles through the Early and Middle Devonian. Comparison of the measured values with the expected values given diversity, computed by applying the null model of Whalen et al. (2020). A. Fluctuations computed at the interval resolution. B. Fluctuations computed at the biozone resolution. See Fig. 2 for interval labels and biozones.
The complex relationship between taxonomic diversity and morphological disparity has been widely investigated and debated; some studies showed a decoupling (e.g., Fortey et al. 1996; Bapst et al. 2012; Missagia et al. 2023) while others demonstrated that the two signals could be coupled (e.g., Whalen et al. 2020; Bault et al. 2023). For our two analyses, whorl profiles and conch morphometry ratios, correlations between taxonomic diversity and the size-based disparity indices (i.e., sum of ranges and convex hull area for PC1 and PC2) are evidenced at the biozone resolution; but for all other indices correlation tests failed to find correlation with the number of species at both the interval and biozone resolutions (SOM 9). According to our results, it appears that diversity and disparity are partially decoupled; this may be dependent on the type of indices used. As such, studies investigating these correlations might benefit from systematically including several of these indices.
Conclusions
The disparity signal is complex, and different patterns can be caught depending on what type of index and temporal to spatial scale we are looking at. According to the size and density-based disparity estimators, a significant rise in ammonoid disparity occurred during the Early Devonian, confirming that ammonoids achieved high disparity levels early in their evolutionary history. Nevertheless, according to the best available testing method used, we found no evidence for an early burst pattern: The measured disparity does not exceed the expectations of the null model. The position-based disparity index shows a distinct pattern, compared to the other indices; a sharp decrease is recorded from the early to the late Emsian, reflecting a shift in the morphospace occupation. Thereafter, the disparity fluctuates following a general moderately decreasing trend trough the Middle Devonian. Among the events occurring during the studied time interval, just the Ka��k Event appears to have impacted the disparity, but only partly: the size-based disparity estimators record a significant decrease after the event, however, the other type of indices do not show significant fluctuations. Diversity and disparity appear partially decoupled (i.e., correlation tests only reveal significant correlations for the size-based disparity indices, at the biozone resolution). From the Early to the Middle Devonian, a progressive trend towards a higher degree of whorl overlap is recorded. The involute conchs with a high whorl overlap are particularly diverse in the Givetian; the involute morphologies correspond to shapes interpreted to be optimised for hydrodynamic efficiency allowing improved swimming abilities (Tendler et al. 2015; Klug et al. 2016). This pattern fits well with the presence of nektonic predators that were already well established during the Devonian, which may have induced a selective pressure in favour of tighter coiled conchs, more suited to changing environments than the Emsian loosely coiled relatives that finally disappeared. The shift recorded by the position-based index through the Early Devonian reflects this transition towards more involute conchs.
Acknowledgements
Thanks to Diego Balseiro (Centro de Investigaciones en Ciencias de la Tierra, C�rdoba, Argentina) for his valuable comments and suggestions that greatly helped to improve the manuscript. The authors also thank Christopher Whalen (Yale University, New Haven, USA) and an anonymous reviewer for their constructive remarks on previous versions of this manuscript. This work is a contribution to the French CNRS UMR 8198 Evo-Eco-Paleo (Universit� de Lille, France). Thanks to the Ministere fran�ais de l�Enseignement Sup�rieur, de la Recherche et de l�Innovation, to the French ANR (project �EvoDevOdonto� to NG), to the Friedrich-Alexander Universit�t (FAU visiting scholarship for female postdoctoral researcher to NA in KDB�s lab), and to the CONICET (postdoctoral fellowship to NA) for their financial support. KDB was supported by I.3.4 Action of the Excellence Initiative�Research University Programme at the University of Warsaw, funded by the Ministry of Education and Science, Poland.
References
Aboussalam, Z.S. and Becker, R.T. 2011. The global Taghanic Biocrisis (Givetian) in the eastern Anti-Atlas, Morocco. Palaeogeography, Palaeoclimatology, Palaeoecology 304: 136�164. Crossref
Aboussalam, Z.S., Becker, R.T., and Bultynck, P. 2015. Emsian (Lower Devonian) conodont stratigraphy and correlation of the Anti-Atlas (Southern Morocco). Bulletin of Geosciences 90: 893�980. Crossref
Adams, D.C., Rohlf, F.J., and Slice, D.E. 2004. Geometric morphometrics: ten years of progress following the �revolution�. Italian Journal of Zoology 71: 5�16. Crossref
Adams, D.C., Rohlf, F.J., and Slice, D.E. 2013. A field comes of age: geometric morphometrics in the 21st century. Hystrix 24: 7�14.
Andreev, P.S., Sansom, I.J., Li, Q., Zhao, W., Wang, J., Wang, C.-C., Peng, L., Jia, L., Qiao, T., and Zhu, M. 2022. Spiny chondrichthyan from the lower Silurian of South China. Nature 609: 969�974. Crossref
Bapst, D.W., Bullock, P.C., Melchin, M.J., Sheets, H.D., and Mitchell, C.E. 2012. Graptoloid diversity and disparity became decoupled during the Ordovician mass extinction. Proceedings of the National Academy of Sciences 109: 3428�3433. Crossref
Bault, V., Cr�nier, C., and Monnet, C. 2023. Coupling of taxonomic diversity and morphological disparity in Devonian trilobites? Historical Biology [published online, https://doi.org/10.1080/08912963.2023.2167601] Crossref
Becker, R.T. 2007. Emsian substages and the Daleje Event�a consideration of conodont, dacryoconarid, ammonoid and sealevel data. Subcommission on Devonian Stratigraphy, Newsletter 22: 29�32.
Becker, R.T. and Aboussalam, Z.S. 2011. Emsian chronostratigraphy�preliminary new data and a review of the Tafilalt (SE Morocco). SDS Newsletter 26: 33�43.
Becker, R.T. and Aboussalam, Z.S. 2013. The global Chote� Event at Jebel Amelane (Western Tafilalt platform)�preliminary data. In: R.T. Becker, A. El Hassani, and A. Tahiri (eds.), Field Guidebook of the International Field Symposium �The Devonian and Lower Carboniferous of northern Gondwana� Morocco 2013. Document de l�Institut Scientifique, Rabat 27: 129�134.
Becker, R.T. and House, M.R. 1994. International Devonian goniatite zonation, Emsian to Givetian, with new records from Morocco. Courier Forschungsinstitut Senckenberg 169: 79�135.
Becker, R.T. and House, M.R. 2000. Late Givetian and Frasnian ammonoid succession at Bou Tchrafine (Anti-Atlas, Southern Morocco). Notes et M�moires du Service G�ologique du Maroc 399: 27�36.
Becker, R.T., Aboussalam, Z.S., Bockwinkel, J., Ebbighausen, V., El Hassani, A., and N�bel, H. 2004. The Givetian and Frasnian at Oued Mzerreb (Tata region, eastern Dra Valley). In: A. El Hassani (ed.), Devonian Neritic-pelagic correlation and events in the Dra Valley (western Anti-Atlas, Morocco). Documents de l�Institut Scientifique, Rabat 19: 29�43.
Becker, R.T., Aboussalam, Z.S., Hartenfels, S., El Hassani, A., and Baidder, L. 2018. Bou Tchrafine�central Tafilalt reference section for Devonian stratigraphy and cephalopod succession. M�nstersche Forschungen zur Geologie und Pal�ontologie 110: 158�187.
Becker, R.T., Aboussalam, Z.S., Hartenfels, S., El Hassani, A., and Fischer, T. 2013. The Givetian�Famennian at Oum el Jerane (Amessoui Syncline, southern Tafilalt). In: R.T. Becker, A. El Hassani, and A. Tahiri (eds.), Field Guidebook of the International Field Symposium �The Devonian and Lower Carboniferous of northern Gondwana� Morocco 2013. Document de l�Institut Scientifique, Rabat 27: 61�76.
Becker, R.T., Klug, C., S�te, T., Hartenfels, S., Aboussalam, Z.S., and El Hassani, A. 2019. The oldest ammonoids of Morocco (Tafilalt, lower Emsian). Swiss Journal of Palaeontology 138: 9�25. Crossref
Becker, R.T., K�nigshof, P., and Brett, C.E. 2016. Devonian climate, sea level and evolutionary events: an introduction. Geological Society of London, Special Publications 423: 1�10. Crossref
Benton, M.J., Forth, J., and Langer, M.C. 2014. Models for the rise of the dinosaurs. Current Biology 24: R87�R95. Crossref
Bockwinkel, J., Becker, R.T., and Aboussalam, Z.S. 2017. Ammonoids from the late Givetian Taouzites Bed of Ouidane Chebbi (eastern Tafilalt, SE Morocco). Neues Jahrbuch f�r Geologie und Pal�ontologie Abhandlungen 284: 307�354. Crossref
Bockwinkel, J., Becker, R.T., and Ebbighausen, V. 2009. Upper Givetian ammonoids from Dar Kaoua (Tafilalt, SE Anti-Atlas, Morocco). Berliner pal�obiologische 10: 61�128.
Bockwinkel, J., Becker, R.T., and Ebbighausen, V. 2013. Late Givetian ammonoids from Hassi Nebech (Tafilalt Basin, Anti-Atlas, southern Morocco). Fossil Record 16: 5�65. Crossref
Bockwinkel, J., Becker, R.T., and Ebbighausen, V. 2015. Late Givetian ammonoids from Ait Ou Amar (northern Maider, Anti-Atlas, southeastern Morocco). Neues Jahrbuch f�r Geologie und Pal�ontologie Abhandlungen 278: 123�158. Crossref
Bonhomme, V., Picq, S., Claude, J., and Gaucherel, C. 2014. Momocs: outline analysis using R. Journal of Statistical Software 56: 1�24. Crossref
Brayard, A., Escarguel, G., Bucher, H., Monnet, C., Br�hwiler, T., Goudemand, N., Galfetti, T., and Guex, J. 2009. Good genes and good luck: ammonoid diversity and the end-Permian mass extinction. Science 325: 1118�1121. Crossref
Brett, C.E. and Walker, S.E. 2002. Predators and Predation in Paleozoic Marine Environments. The Paleontological Society Papers 8: 93�118. Crossref
Brosse, M., Brayard, A., Fara, E., and Neige, P. 2013. Ammonoid recovery after the Permian�Triassic mass extinction: a re-exploration of morphological and phylogenetic diversity patterns. Journal of the Geologi�cal Society 170: 225�236. Crossref
Bucher, H., Landman, N.H., Klofak, S.M., and Guex, J. 1996. Mode and rate of growth in ammonoids. In: N.H. Landman, K. Tanabe, and R.A. Davis (eds.), Ammonoid Paleobiology. Topics in Geobiology 13: 407�461. Crossref
Budd, G.E. 2021. Morphospace. Current Biology 31: R1181�R1185. Crossref
Chamberlain, J.A. 1976. Flow patterns and drag coefficients of cephalopod shells. Palaeontology 19: 539�563.
Chamberlain, J.A. 1981. Hydromechanical Design of Fossil Cephalopods. In: R.M. House and J.R. Senior (eds.), The Ammonoidea: The Evolution, Classification, Mode of Life, and Geological Usefulness of a Major Fossil Group. Systematics Association Special Volume 18: 289�336.
Chlup��, I. and Turek, V. 1983. Devonian goniatites from the Barrandian area, Czechoslovakia. Rozpravy �st�edn� �stav geologick? 46: 1�159.
Chlup��, I. and Kukal, Z. 1986. Reflection of possible global Devonian events in the Barrandian area, CSSR. In: O.H. Walliser (ed.), Global Bio-Events, 169�179. Springer Berlin. Crossref
Chlup��, I. and Kukal, Z. 1988. Possible global events and the stratigraphy of the Palaeozoic of the Barrandian (Cambrian�Middle Devonian, Czechoslovakia). Sborn�k geologick�ch v�d, Geologie 43: 83�146.
Ciampaglio, C.N., Kemp, M., and McShea, D.W. 2001. Detecting changes in morphospace occupation patterns in the fossil record: characterization and analysis of measures of disparity. Paleobiology 27: 695�715. Crossref
Cichowolski, M. and Rust�n, J.J. 2017. First report of Devonian bactritids (Cephalopoda) from South America: paleobiogeographic and biostratigraphic implications. Journal of Paleontology 91: 417�433. Crossref
Crampton, J.S. 1995. Elliptic Fourier shape analysis of fossil bivalves: some practical considerations. Lethaia 28: 179�186. Crossref
De Baets, K., Klug, C., and Plusquellec, Y. 2010. Zl�chovian faunas with early ammonoids from Morocco and their use for the correlation of the eastern Anti-Atlas and the western Dra Valley. Bulletin of Geosciences 85: 317�352. Crossref
De Baets, K., Klug, C., Korn, D., and Landman, N.H. 2012. Early evolutionary trends in ammonoid embryonic development. Evolution 66: 1788�1806. Crossref
De Baets, K., Klug, C., Korn, D., Bartels, C., and Poschmann, M. 2013. Emsian Ammonoidea and the age of the Hunsr�ck Slate (Rhenish Mountains, Western Germany). Palaeontographica A 299: 1�113. Crossref
De Baets, K., Landman, N.H., and Tanabe, K. 2015. Ammonoid Embryonic Development. In: C. Klug, D. Korn, K. De Baets, I. Kruta, and R.H. Mapes (eds.), Ammonoid Paleobiology: From Anatomy to Ecology. Topics in Geobiology 43: 113�205. Crossref
Dera, G., Toumoulin, A., and De Baets, K. 2016. Diversity and morpholo�gical evolution of Jurassic belemnites from South Germany. Palaeo�geo�graphy, Palaeoclimatology, Palaeoecology 457: 80�97. Crossref
Dommergues, J.-L., Laurin, B., and Meister, C. 1996. Evolution of ammo�noid morphospace during the Early Jurassic radiation. Paleobio�logy 22: 219�240. Crossref
Dzik, J. 2020. Decline in diversity of early Palaeozoic loosely coiled gastropod protoconchs.�Lethaia 53�: 32�46. Crossref
Ebbighausen, V., Becker, R.T., and Bockwinkel, J. 2011. Emsian and Eife�lian ammonoids from Oufrane, eastern Dra Valley (Anti-Atlas, Morocco)�taxonomy, stratigraphy and correlation. Neues Jahrbuch f�r Geologie und Pal�ontologie Abhandlungen 259: 313�379. Crossref
Erben, H.K. 1953. Goniatitacea (Ceph.) aus dem Unterdevon und unterem Mitteldevon. Neues Jahrbuch f�r Geologie und Pal�ontologie 98: 175�225.
Erben, H.K. 1960. Primitive Ammonoidea aus dem Unterdevon Frankreichs und Deutschlands. Neues Jahrbuch f�r Geologie und Pal�ontologie Abhandlungen 110: 1�128.
Erben, H.K. 1964. Die Evolution der altesten Ammonoidea. Neues Jahrbuch f�r Geologie und Pal�ontologie Abhandlungen 120: 107�212.
Erben, H.K. 1965. Die Evolution der �ltesten Ammonoidea (Lieferung II). Neues Jahrbuch f�r Geologie und Pal�ontologie Abhandlungen 122: 275�312.
Erben, H.K. 1966. �ber den Ursprung der Ammonoidea. Biological Review of the Cambridge Philosophical Society 41: 641�658. Crossref
Erwin, D.H. 2007. Disparity: morphological pattern and developmental context. Palaeontology 50: 57�73. Crossref
Ferr�n, H.G. and Donoghue, P.C.J. 2022. Evolutionary analysis of swimming speed in early vertebrates challenges the �New Head Hypothesis�. Communications Biology 5: 863. Crossref
Ferrova, L., Fr�da, J., and Luke�, P. 2012. High-resolution tentaculite biostratigraphy and facies development across the Early Devonian Daleje Event in the Barrandian (Bohemia): implications for global Emsian stratigraphy. Bulletin of Geosciences 87: 587�624. Crossref
Ferrova, L., Fr�da, J., Luke�, P., and Fr�dov�, B. 2013. New data on the Daleje Event from the Barrandian (Bohemia) as a key for progress in Emsian stratigraphy. In: A. El Hassani, R.T. Becker, and A. Tahiri (eds.), International Field Symposium �The Devonian and Lower Carboniferous of northern Gondwana� Morocco 2013. Document de l�Institut Scientifique, Rabat 26: 44�45.
Ferson, S., Rohlf, F.J., and Koehn, R.K. 1985. Measuring shape variation of two-dimensional outlines. Systematic Biology 34: 59�68. Crossref
Friedman, M. 2022. Fossils reveal the deep roots of jawed vertebrates. Nature 609: 897�898. Crossref
Foote, M. 1991. Morphologic patterns of diversification: examples from trilobites. Palaeontology 34: 461�485.
Foote, M. 1993. Contributions of individual taxa to overall morphological disparity. Paleobiology 19: 403�419. Crossref
Foote, M. 1994. Morphological disparity in Ordovician�Devonian crinoids and the early saturation of morphological space. Paleobiology 20: 320�344. Crossref
Foote, M. 1997. The evolution of morphological diversity. Annual Review of Ecology and Systematics 28: 129�152. Crossref
Fortey, R.A., Briggs, D.E.G., and Wills, M.A. 1996. The Cambrian evolutionary �explosion�: decoupling cladogenesis from morphological disparity. Biological Journal of the Linnean Society 57: 13�33. Crossref
Frey, L., Naglik, C., Hofmann, R., Schemm-Gregory, M., Fryda, J., Kroe�ger, B., Taylor, P.D., Wilson, M.A., and Klug, C. 2014. Diversity and palaeoecology of Early Devonian invertebrate associations in the Tafilalt (Anti-Atlas, Morocco). Bulletin of Geosciences 89: 75�112. Crossref
Garc�a-Alcalde, J.L. 1997. North Gondwanan Emsian events. Episodes 20: 241�246. Crossref
Guex, J. 2003. A generalization of Cope�s rule. Bulletin de la Soci�t� g�o�logique de France, 174: 449�452. Crossref
Guillerme, T., Puttick, M.N., Marcy, A.E., and Weisbecker, V. 2020. Shifting spaces: Which disparity or dissimilarity measurement best summarize occupancy in multidimensional spaces? Ecology and Evolution 10: 7261�7275. Crossref
Gunz, P. and Mitteroecker, P. 2013. Semilandmarks: a method for quantifying curves and surfaces. Hystrix 24: 103�109.
Haines, A.J. and Crampton, J.S. 2000. Improvements to the method of Fourier shape analysis as applied in morphometric studies. Palaeontology 43: 765�783. Crossref
Haining, R. 1991. Bivariate correlation with spatial data.�Geographical Analysis�23: 210�227. Crossref
Hebdon, N., Polly, P.D., Peterman, D.J., and Ritterbush, K.A. 2022. Detec�ting mismatch in functional narratives of animal morphology: a test case with fossils.�Integrative and Comparative Biology 62: 817�828. Crossref
Hoffmann, R., Lemanis, R., Naglik, C., and Klug, C. 2015. Ammonoid buoyancy. In: C. Klug, D. Korn, K. De Baets, I. Kruta, and R.H. Mapes (eds.), Ammonoid Paleobiology: From Anatomy to Ecology. Topics in Geobiology 43: 613�648. Crossref
Hoffmann, R., Weinkauf, M.F., Fuchs, D., and Lukeneder, A. 2021. Is there more than one species in the genus Spirula (Cephalopoda: Decabrachia): evidence for an Atlantic�Pacific divide. Journal of Molluscan Studies 87: eyab001. Crossref
Hoffmann, R., Weinkauf, M.F., Wiedenroth, K., Goeddertz, P., and De Baets, K. 2019. Morphological disparity and ontogeny of the endemic heteromorph ammonite genus Aegocrioceras (Early Cretaceous, Hauterivian, NW-Germany). Palaeogeography, Palaeoclimatology, Palaeoecology 520: 1�17. Crossref
Hopkins, M.J. 2022. Single disparity indices can be misleading: comment on Su�rez & Esteve (2021). Lethaia 55: 1�3. Crossref
House, M.R. 1985. Correlation of mid-Palaeozoic ammonoid evolutionary events with global sedimentary perturbations. Nature 313: 17�22. Crossref
House, M.R. 1988. Major features of cephalopod evolution. In: J. Wiedmann and J. Kullmann (eds.), Cephalopods. Present and Past, 1�16. Schweizerbart, Stuttgart.
House, M.R. 1989. Ammonoid extinction events. Philosophical Transactions of the Royal Society of London Biological Sciences 325: 307�326. Crossref
House, M.R. 1996a. Juvenile goniatite survival strategies following Devonian extinction events. Geological Society of London, Special Publications 102: 163�185. Crossref
House, M.R. 1996b. The Middle Devonian Ka��k Event. Proceedings of the Ussher Society 9: 79�84.
House, M.R. 2002. Strength, timing, setting and cause of mid-Palaeozoic extinctions. Palaeogeography, Palaeoclimatology, Palaeoecology 181: 5�25. Crossref
Hughes, M., Gerber, S., and Wills, M. 2013. Clades reach highest morphological disparity early in their evolution. Proceedings of the National Academy of Sciences of the United States of America 110: 13875�13879. Crossref
Kennedy, W.J. and Cobban, W.A. 1976. Aspects of ammonite biology, biogeography, and biostratigraphy. Special Papers in Palaeontology 17: 1�94.
Klein, C. and Korn, D. 2014. A morphometric approach to conch ontogeny of Cymaclymenia and related genera (Ammonoidea, Late Devonian). Fossil Record 17: 1�32. Crossref
Klug, C. 2001a. Early Emsian ammonoids from the eastern Anti-Atlas (Morocco) and their succession. Pal�ontologische Zeitschrift 74: 479�515. Crossref
Klug, C. 2001b. Life-cycles of some Devonian ammonoids. Lethaia 34: 215�233. Crossref
Klug, C. 2002a. Conch parameters and habitats of Emsian and Eifelian Ammonoids from the Tafilalt (Morocco) and their relation to the global events. In: H. Summesberger, K. Histon, and A. Daurer (eds.), Cephalopods�Present and Past. Abhandlungen der Geologischen Bundesanstalt 57: 523�538.
Klug, C. 2002b. Quantitative stratigraphy and taxonomy of late Emsian and-Eifelian ammonoids of the eastern Anti-Atlas (Morocco). Courier Forschungsinstitut Senckenberg 238: 1�109.
Klug, C. 2007. Sublethal injuries in Early Devonian cephalopod shells from Morocco. Acta Palaeontologica Polonica 52: 749�759.
Klug, C. 2017. First description of the early Devonian ammonoid Mimosphinctes from Gondwana and stratigraphical implications. Swiss Journal of Palaeontology 136: 345�358. Crossref
Klug, C. and Korn, D. 2004. The origin of ammonoid locomotion. Acta Palaeontologica Polonica 49: 235�242.
Klug, C., De Baets, K., and Korn, D. 2016. Exploring the limits of morphospace: Ontogeny and ecology of Late Vis�an ammonoids from the Tafilalt, Morocco. Acta Palaeontologica Polonica 61: 1�14. Crossref
Klug, C., Frey, L., Pohle, A., De Baets, K., and Korn, D. 2017. Palaeozoic evolution of animal mouthparts. Bulletin of Geosciences 92: 439�442. Crossref
Klug, C., Korn, D., and Reisdorf, A. 2000. Ammonoid and conodont strati�graphy of the late Emsian to early Eifelian (Devonian) at the Jebel Ouaoufilal (near Taouz, Tafilalt, Morocco). In: A. Tahiri and A. El Hassani (eds.), Proceding of the Subcommission on Devonian Stratigraphy (SDS)�IGCP 421 Morocco Meeting. Travaux de l�Institut Scientifique, Rabat, S�rie G�ologique and G�ographie Physique 20: 45�56.
Klug, C., Korn, D., Landman, N.H., Tanabe, K., De Baets, K., and Naglik, C. 2015a. Describing ammonoid conch. In: C. Klug, D. Korn, K. De Baets, I. Kruta, and R.H. Mapes (eds.), Ammonoid Paleobiology: From Anatomy to Ecology. Topics in Geobiology 43: 3�24. Crossref
Klug, C., Kr�ger, B., Kiessling, W., Mullins, G.L., Servais, T., Fr�da, J., Korn, D. and Turner, S. 2010. The Devonian nekton revolution. Lethaia 43: 465�477. Crossref
Klug, C., Kr�ger, B., Korn, D., Ruecklin, M., Schemm-Gregory, M., De Baets, K., and Mapes, R.H. 2008a. Ecological change during the early Emsian (Devonian) in the Tafilalt (Morocco), the origin of the Ammonoidea, and the first African pyrgocystid edrioasteroids, machaerids and phyllocarids. Palaeontographica A 283: 83�176. Crossref
Klug, C., Kr�ger, B., Vinther, J., Fuchs, D., and De Baets, K. 2015b. Ancestry, origin and early evolution of ammonoids. In: C. Klug, D. Korn, K. De Baets, I. Kruta, and R.H. Mapes, (eds.), Ammonoid Paleobio�logy: From Macroevolution to Paleogeography. Topics in Geobiology 44: 3�24. Crossref
Klug, C., Meyer, E.P., Richter, U., and Korn, D. 2008b. Soft-tissue imprints in fossil and Recent cephalopod septa and septum formation. Lethaia 41: 477�492. Crossref
Korn, D. 1999. Septal projections�a method for the illustration of septa in early ammonoids. In: A.Y. Rozanov and A.A. Shevyrev (eds.), Fossil Cephalopods: Recent Advances in Their Study, 62�67. Paleontologi�eskij Institut RAN, Moscow.
Korn, D. 2001. Morphometric evolution and phylogeny of Palaeozoic ammonoids. Early and Middle Devonian. Acta Geologica Polonica 51: 193�215.
Korn, D. 2010. A key for the description of Palaeozoic ammonoids. Fossil Record 13: 5�12. Crossref
Korn, D. and Klug, C. 2002. Ammoneae Devonicae. In: W. Riegraf (ed.), Fossilium Catalogus I: Animalia 138, xviii, 375 pp. Backhuys, Leiden.
Korn, D. and Klug, C. 2003. Morphological pathways in the evolution of Early and Middle Devonian ammonoids. Paleobiology 29: 329�348. Crossref
Korn, D. and Klug, C. 2012. Palaeozoic ammonoids�diversity and deve�lopment of conch morphology. In: J.A. Talent (ed.), Earth and Life, International Year of Planet Earth Series, 491�534. Springer, Dordrecht. Crossref
Korn, D., Klug, C., and Walton, S.A. 2015. Taxonomic diversity and morphological disparity of Paleozoic ammonoids. In: C. Klug, D. Korn, K. De Baets, I. Kruta, and R.H. Mapes (eds.), Ammonoid Paleobiology: From Macroevolution to Paleogeography. Topics in Geobiology 44: 431�464. Crossref
Kr�ger, B. 2005. Adaptive evolution in Paleozoic coiled cephalopods. Paleobiology 31: 253�268. Crossref
Kr�ger, B. and Mapes, R.H. 2007. On the origin of bactritoids (Cephalopoda). Pal�ontologische Zeitschrift 81: 316�327. Crossref
Kuhl, F.P. and Giardina, C.R. 1982. Elliptic Fourier features of a closed contour. Computer Graphics and Image Processing 18: 236�258. Crossref
Lestrel, P.E. (ed.) 1997. Fourier Descriptors and Their Applications in Bio�logy. 486 pp. Cambridge University Press, Cambridge. Crossref
Maillet, S., Danelian, T., Monnet, C., Cr�nier, C., and Milhau, B. 2015. Biodiversity changes of ostracods across the late Mid-Devonian global Taghanic biocrisis. In: B. Mottequin, J. Denayer, P. K�nigshof, C. Prestianni, and S. Olive (eds.), IGCP 596�SDS Symposium Climate Change and Biodiversity Patterns in the Mid-Palaeozoic. Strata Series 1 16: 85�86.
Missagia, R.V., Casali, D.M., Patterson, B.D., and Perini, F.A. 2023. Decoupled patterns of diversity and disparity characterize an ecologically specialized lineage of neotropical cricetids. Evolutionary Biology 50: 181�196. Crossref
Monnet, C., De Baets, K., and Klug, C. 2011. Parallel evolution controlled by adaptation and covariation in ammonoid cephalopods. BMC Evolutionary Biology 11: 1�21. Crossref
Monnet, C., Klug, C., and De Baets, K. 2015. Evolutionary patterns of ammonoids: phenotypic trends, convergence, and parallel evolution. In: C. Klug, D. Korn, K. De Baets, I. Kruta, and R.H. Mapes (eds.), Ammonoid Paleobiology: From Macroevolution to Paleogeography. Topics in Geobiology 44: 95�142. Crossref
Mor�n-Alfonso, D.A., Hoffmann, R., and Cichowolski, M. 2021. Geometric morphometrics in ammonoids based on virtual modelling. Palaeontologia Electronica 24: 1�23. Crossref
Naglik, C., DeBaets, K., and Klug, C. 2019. Early Devonian ammonoid faunas in the Zeravshan Mountains (Uzbekistan and Tadjikistan) and the transition from a carbonate platform setting to pelagic sedimentation. Bulletin of Geosciences 94: 337�368. Crossref
Naglik, C., Tajika, A., Chamberlain, J., and Klug, C. 2015. Ammonoid locomotion. In: C. Klug, D. Korn, K. De Baets, I. Kruta, and R.H. Mapes (eds.), Ammonoid Paleobiology: From Anatomy to Ecology. Topics in Geobiology 43: 649�688. Crossref
Nardin, E., Rouget, I., and Neige, P. 2005. Tendencies in paleontological practice when defining species, and consequences on biodiversity studies. Geology 33: 969�972. Crossref
Narkiewicz, K., Narkiewicz, M., and Bultynck, P. 2016. Conodont biofacies of the Taghanic transgressive interval (middle Givetian): Polish record and global comparisons. Geological Society of London, Special Publications 423: 201�222. Crossref
N�tscher, P.S., Dera, G., Reddin, C.J., Rita, P., and De Baets, K. 2021. Morphological response accompanying size reduction of belemnites during an Early Jurassic hyperthermal event modulated by life history. Scientific Reports 11: 1�11. Crossref
Neige, P. 2003. Spatial patterns of disparity and diversity of the Recent cuttlefishes (Cephalopoda) across the Old World. Journal of Biogeography 30: 1125�1137. Crossref
N�tzel, A. and Fr�da, J. 2003. Paleozoic plankton revolution: evidence from early gastropod ontogeny. Geology 31: 829�831. Crossref
Oyston, J.W., Hughes, M., Wagner, P.J., Gerber, S., and Wills, M.A. 2015. What limits the morphological disparity of clades? Interface Focus 5: 20150042. Crossref
Pearson, K. 1896. Mathematical contributions to the theory of evolution. Regression, heredity, and panmixia. Philosophical Transactions of the Royal Society of London, Series A, Containing Papers of a Mathematical or Physical Character 187: 253�318. Crossref
R Core Team. 2016. R: A Language and Environment for Statistical Computing, version 3.3.0. R Foundation for Statistical Computing, Vienna.
Raup, D.M. 1966. Geometric analysis of shell coiling: general problems. Journal of Paleontology 40: 1178�1190.
Raup, D.M. 1967. Geometric analysis of shell coiling: coiling in ammo�noids. Journal of Paleontology 41: 43�65.
Raup, D.M. and Michelson, A. 1965. Theoretical morphology of the coiled shell. Science 147: 1294�1295. Crossref
Reyment, R.A. and Kennedy, W.J. 1991. Phenotypic plasticity in a cretaceous ammonite analyzed by multivariate statistical methods. A metho�dological study. Evolutionary Biology 25: 411�426.
Ritterbush, K.A., Hoffmann, R., Lukeneder, A., and De Baets, K. 2014. Pelagic palaeoecology: the importance of recent constraints on ammonoid palaeobiology and life history. Journal of Zoology 292: 229�241. Crossref
Roy, K. and Foote, M. 1997. Morphological approaches to measuring biodiversity. Trends in Ecology and Evolution 12: 277�281. Crossref
Saunders, W.B. and Shapiro, E.A. 1986. Calculation and simulation of ammonoid hydrostatics. Paleobiology 12: 64�79. Crossref
Saunders, W.B., Greenfest-Allen, E., Work, D.M., and Nikolaeva, S.V. 2008. Morphologic and taxonomic history of Paleozoic ammonoids in time and morphospace. Paleobiology 34: 128�154. Crossref
Schindewolf, O.H. 1933. Vergleichende Morphologie und Phylogenie der Anfangskammern tetrabranchiater Cephalopoden. Eine Studie �ber Herkunft, Stammesentwicklung und System der niederen Ammoneen. Abhandlungen der Preu?ischen Geologischen Landesanstalt, Neue Folge 148: 1�115.
Simon, M.S., Korn, D., and Koenemann, S. 2010. Disparity fluctuations in Jurassic ammonoids by means of conch geometry. Palaeogeography, Palaeoclimatology, Palaeoecology 292: 520�531. Crossref
Simpson, G.G. 1944. Tempo and Mode in Evolution. 237 pp. Columbia Uni�versity Press, New York City.
Suttner, T.J., Kido, E., Corradini, C., Vodr�kov�, S., Pondrelli, M., and Simo�netto, L. 2017. Conodont diversity across the late Eifelian Ka��k Epi�sode of the southern Alpine realm (central Carnic Alps, Austria/Italy). Palaeogeography, Palaeoclimatology, Palaeoecology 479: 34�47. Crossref
Teichert, C. 1986. Times of crisis in the evolution of the Cephalopoda. Pal�ontologische Zeitschrift 60: 227�243. Crossref
Tendler, A., Mayo, A., and Alon, U. 2015. Evolutionary tradeoffs, Pareto optimality and the morphology of ammonite shells. BMC Systems Bio�logy 9: 1�12. Crossref
Turnau, E. 2014. Floral change during the Taghanic Crisis: Spore data from the Middle Devonian of northern and south-eastern Poland. Review of Palaeobotany and Palynology 200: 108�121. Crossref
Wagner, P.J. 2018. Early bursts of disparity and the reorganization of character integration. Proceedings of the Royal Society Biological Sciences 285: 20181604. Crossref
Wagner, P.J. and Erwin, D.H. 2006. Patterns of convergence in general shell form among Paleozoic gastropods. Paleobiology 32: 316�337. Crossref
Walker, J.D., Geissman, J.W., Bowring, S.A., and Babcock, L.E. 2018. GSA Geologic Time Scale v. 5.0. Geological Society of America.
Walliser, O.H. 1984. Geologic processes and global events. Terra Cognita 4: 17�20.
Walliser, O.H. 1996. Global events in the Devonian and Carboniferous. In: O.H. Walliser (ed.), Global Events and Event Stratigraphy in the Phanerozoic, 225�250. Springer Berlin. Crossref
Walton, S.A. and Korn, D. 2018. An ecomorphospace for the Ammonoidea. Paleobiology 44: 273�289. Crossref
Wills, M.A. 2001. Morphological disparity: A primer. In: J.M. Adrain, G.D. Edgecombe, and B.S. Lieberman (eds.), Fossils, Phylogeny, and Form: An Analytical Approach. Topics in Geobiology 19: 55�144. Crossref
Wills, M.A., Briggs, D.E., and Fortey, R.A. 1994. Disparity as an evolutionary index: a comparison of Cambrian and Recent arthropods. Paleobiology 20: 93�130. Crossref
Whalen, C.D. and Briggs, D.E.G. 2018. The Palaeozoic colonization of the water column and the rise of global nekton. Proceedings of the Royal Society Biological Sciences 285: 20180883. Crossref
Whalen, C.D., Hull, P.M., and Briggs, D.E.G. 2020. Paleozoic ammonoid ecomorphometrics test ecospace availability as a driver of morphological diversification. Science Advances 6: eabc2365. Crossref
Zambito, J.J., Brett, C.E., and Baird, G.C. 2012. The Late Middle Devonian (Givetian) Global Taghanic Biocrisis in its type area (Northern Appalachian Basin): Geologically rapid faunal transitions driven by global and local environmental changes. In: J.A. Talent (ed.), Earth and Life: Global Biodiversity, Extinction Intervals and Biogeographic Perturbations Through Time, 677�703. Springer, Dordrecht. Crossref
Zelditch, M.L., Swiderski, D.L., and Sheets, H.D. 2012. Geometric Morphometrics for Biologists: A Primer. 478 pp. Academic Press, San Diego.
Zhu, Y., Li, Q., Lu, J., Chen, Y., Wang, J., Gai, Z., Zhao, W., Wei, G., Yu, Y., and Ahlberg, P.E. 2022. The oldest complete jawed vertebrates from the early Silurian of China. Nature 609: 954�958. Crossref
Acta Palaeontol. Pol. 68 (2): 193�212, 2023
https://doi.org/10.4202/app.01033.2022