
Evaluating the utility of linear measurements to identify isolated tooth loci of extinct Hyracoidea
NATASHA S. VITEK and PATRICIA M. PRINCEHOUSE
Vitek, N.S. and Princehouse, P.M. 2024. Evaluating the utility of linear measurements to identify isolated tooth loci of extinct Hyracoidea. Acta Palaeontologica Polonica 69 (1): 109–126.
Serially homologous elements pose an identification problem in fragmentary records, particularly those of vertebrate fossils. Examples include individual vertebrae in the vertebral column and teeth in a tooth row. Until an isolated element can be accurately attributed to a specific position within its series, multiple lines of ecological and evolutionary research cannot be conducted. However, varying levels of differentiability between loci, and varying patterns of differentiation across clades, make it impossible to develop a single set of diagnostic traits for any particular set of serial homologues, particularly mammalian molars. Here, we test the utility of a set of classification criteria for distinguishing molar tooth positions of hyraxes (Mammalia, Afrotheria, Hyracoidea), which have been considered indistinguishable in previous taxonomic studies. As part of the test we evaluate the degree to which between-locus variation is conservative in this taxon, which would strengthen the predictive power of proposed traits even in cases where species identity is unknown. Suitable tests for hypotheses of conservatism in categorical traits did not exist, to our knowledge, and we therefore explored the behavior of a previously developed metrics, Borges et al.’s δ, to assess conservatism in contrast to phylogenetic signal produced by Brownian motion. This metric shows some promise but the nature of resulting distributions makes tests difficult to interpret, indicating a line of potential future methods improvement. We used a linear morphometric characterization of shape to validate the candidate traits. In the case of hyracoid molars, relatively simple ratios of linear measurements have strong discriminatory power despite evolutionary variation in between-locus differences. Overall, new or understudied taxa are likely to have lower molar loci differentiable by their relative length and talonid vs. trigonid width.
Key words: Mammalia, Afrotheria, Hyracoidea, morphometrics, Africa, Fayum, molars, phylogenetic conservatism, inhibitory cascade.
Natasha S. Vitek [natasha.vitek@stonybrook.edu; ORCID: https://orcid.org/0000-0003-0587-8907 ], Department of Ecology & Evolution, Stony Brook University, 632 Life Sciences Building, Stony Brook University, Stony Brook, NY 11794-5245, USA.
Patricia M. Princehouse [pmp7@case.edu; ORCID: https://orcid.org/0000-0001-9848-5621 ], Institute for the Science of Origins, Case Western Reserve University, 10900 Euclid Ave. Cleveland, OH 44106, USA.
Received 27 July 2023, accepted 23 February 2024, published online online 27 March 2024.
Copyright © 2024 N.S. Vitek and P.M. Princehouse. This is an open-access article distributed under the terms of the Creative Commons Attribution License (for details please see http://creativecommons.org/licenses/by/4.0/), which permits unrestricted use, distribution, and reproduction in any medium, provided the original author and source are credited.
Introduction
The fragmentary nature of the paleontological and archeological record means that much of the evidence for past vertebrate life is in isolated skeletal remains (Korth 1979; Badgley 1986; Cassiliano 1997; Cuvier 2009). A number of biological attributes can be inferred from isolated elements, including reconstructions of body size, diet, locomotor mode, and growth rate, as well as the spatiotemporal range of a taxon (Janis 1990; Bever 2005; Boyer 2008; Weaver et al. 2022).
However, accuracy of proxies rests on identification of both species and serial position, two main sources of uncertainty that contribute morphological variation. The task of identifying serial position includes the correct position, or locus, for elements in serially homologous sequences like teeth in tooth rows and vertebrae in vertebral columns (Polly and Head 2004; Zack 2012; Calede and Glusman 2017; Engelman and Croft 2022). In depositional environments where associated teeth can be scarce, the inability to correctly identify isolated elements to specific loci can cause the exclusion of records from datasets, limiting the scope of ecological inference such as relative abundance based on minimum number of individuals, or evolutionary inference about the evolution of modularity and integration between members of such serially homologous sequences (Naylor and Marcus 1994; Pickford 1994; Borths and Stevens 2019).
Solving the locus identification part of the identification problem makes the species identification problem easier to solve. For mammalian molars, the serial position problem may be easier to solve first because the number of possible states is more constrained, as opposed to the unknown number of species that may be present in new or understudied assemblages. Most crown mammals have either three (Eutheria) or four (Metatheria) molar loci, creating three or four discrete groups for any tooth locus identification problem. In contrast to the predictable number of locus categories, the number of potential species in an assemblage is an unknown. It is rarely clear from the outset how many species are present, and how similar or dissimilar they might be expected to be from one another.
In some taxonomic systems, identifying tooth loci is a challenge. Some serial homologues differ very little from each other, requiring significant expertise to distinguish (Clemens 1966). Features that distinguish between morphologically similar serial homologues are rarely the presence or absence of discrete features, but instead changes in the location, size, or shape of one feature relative to another (Böhmer et al. 2015; Head and Polly 2015; Jones et al. 2018). Other serial homologues often differ from each other in a characteristic pattern shared by members of a single developmental field, or module (Butler 1939; Young et al. 2015). However, the characteristic pattern can and does evolve, limiting its predictive power in cases of new or poorly known species (Kimura et al. 2013).
For example, the molar sizes along a toothrow often vary in a unidirectional, proportional pattern allowing the prediction of the size of one molar based on the other two (Kavanagh et al. 2007). However, the exact direction and proportion is not constant across mammals (Polly 2007). Within some clades, such as Rodentia, these relationships between tooth loci vary widely (Labonne et al. 2012). These unknown species-specific relationships between tooth loci may be stronger than any general diagnostic trait, rendering a proposed, general trait invalid for use when species identities are unknown.
In this paper, the goal is to evaluate a set of classification criteria that can be used to assign individual molars to serial position, regardless of whether other sources of variation in teeth have been completely identified. In addition to variation between different species, additional sources of variation potentially include sexual dimorphism, plasticity including age-related differences, and damage to the tooth in vivo or taphonomically (Benazzi et al. 2011). These sources of variation may interact with one another, creating a more complex problem. Larger sample sizes rich with information on each variable, or even all but one variable, could solve the problem. However, fossil samples are classically data-deficient in this regard, both in terms of small sample sizes and lack of information about variables such as sex and ontogeny. Effective validation methods must identify traits that avoid the problem either by being rich in information or by being robust to the influence of extraneous sources of information. Unfortunately, otherwise powerful methods that rely on large training datasets, such as machine learning or artificial intelligence, are fundamentally poorly suited for cases in the fossil record limited by very small sample sizes (Chicco 2017).
A phylogenetic bracket may help assess sensitivity of the trait to other potentially confounding influences that cannot be minimized, although the tool is not always applicable (Witmer 1995). In scenarios that are likely to be permanently data-deficient, like fossils, the phylogenetic bracket may be a better tool than more sophisticated statistical treatment of species-specific trait diagnoses. Rather than try to enumerate all potentially confounding sources of variation in the target sample of isolated, data-deficient species, the bracket validates a relationship in more data-rich species (Witmer 1995). It then makes the assumption that members of the minimum clade defined by that bracket share the same relationship validity, based on assuming phylogenetic conservatism. For example, if a trait distinguishes loci in bracketing species, then the trait is also inferred to be diagnostic for new species within the clade. As such, it is considered robust to species-specific departures from the trait-locus relationship. If the trait-locus relationship is insensitive to potentially confounding influences like ontogeny and dimorphism in the bracketing species, it is inferred to also be robust to these influences in other, more data deficient members of the clade. Inferences from the phylogenetic bracket can be applied to a sample even when the number of species in the sample is unknown. However, use of the phylogenetic bracket makes assumptions about the applicability of trait relationships from one taxon to another, including assumptions of little phylogenetic change in trait relationships that may not be valid over large spans of evolutionary change. It is important to test the assumption of phylogenetic conservatism through phylogenetic comparative methods, because some traits are remarkably labile and do not meet this assumption (Blomberg et al. 2003).
Hyracoid molars represent a biologically realistic, unsolved challenge of distinguishing morphologically similar serial homologues that is suitable for this kind of approach (Pickford 1994; Pickford et al. 1994; Tsujikawa and Pickford 2006; Barrow 2011). Other examples of this problem include the molars of multiple clades of herbivorous mammals or vertebrate clades with weakly regionalized vertebral columns (Fortelius 1985; Polly and Head 2004; Head and Polly 2015). Results of prior morphometric studies suggest that individual hyracoid molar tooth loci can be discriminated (Barrow et al. 2008; Barrow 2011), but to date these assessments have limited application, lacking published guidance that can be applied to other studies.
We focus our efforts in this case study on distinguishing first from second molars. In many taxa, the first two lower molars are the most challenging cheek teeth to identify in isolation because their number and general arrangement of features is identical. At best, they differ in subtle proportions and relative sizes. The crowns of lower third molars (m3) are identifiable by a distinctively enlarged hypoconulid (Rasmussen and Simons 1988; Barrow 2011; Asher et al. 2017). However, in hyracoids an enlarged m3 hypoconulid feature is not universally shared among all sampled taxa, and therefore in certain cases third molars can also pose a challenge (Asher et al. 2017). Upper first and second molars present a similar challenge (Pickford et al. 1994). The only proposed diagnostic feature that might be shared among all hyracoids has been the relative size of each tooth in the toothrow (Barrow 2011), a feature known to overlap between loci and therefore still leave the position of some isolated teeth ambiguous (Pickford 1994). In this state of knowledge, isolated teeth of some hyracoids remain ambiguously identified, especially those that could be either first or second molars (Pickford 1994; Pickford et al. 1994).
Hyracoids also represent the limitations of a straightforward, extant phylogenetic bracket. Extant species represent only a narrow range of the phylogenetic and morphological diversity that has existed in hyracoids (Fig. 1; Seiffert 2007; Cooper et al. 2014). Most species of hyracoids are extinct and represented only by fossils. Extant species, such as Procavia capensis, have multiple derived features, including high crowns and highly reduced m3 hypoconulids, compared to most of the extinct taxa to which we wanted to apply results (Fig. 1; Asher et al. 2017). The closest relatives of Hyracoidea, Sirenia, and Proboscidea, which might help form an extant phylogenetic bracket, also have unsuitably highly derived dental morphology (Stanhope et al. 1998). In short, one reason that tooth loci of extinct species of hyracoid are difficult to diagnose is that a reasonable extant phylogenetic bracket for inferring their likely diagnostic traits does not exist.
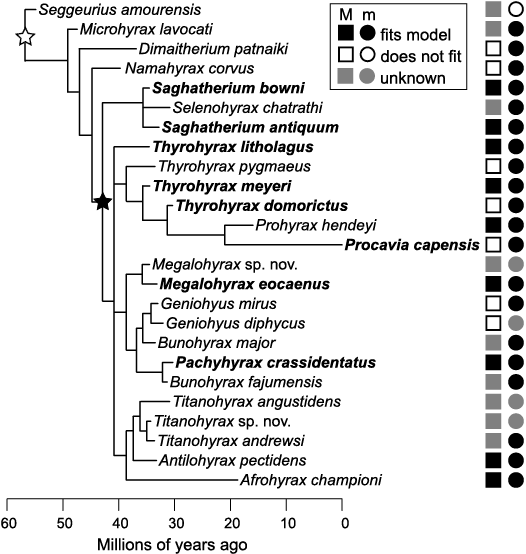
Fig. 1. Phylogenetic tree and tooth size distribution in hyracoids (topology from Cooper et al. 2014). Taxa are time-scaled along the x-axis of the tree to reflect fossil occurrences based on the literature, with branches rescaled between these tip dates and a root age estimated at 70.1 million years. Taxa in bold text were included in analyses. Minimum monophyletic clade including taxa in bold indicates the range of the phylogenetic bracket applied for both length and width measures (base of clade indicated by black star). Minimum monophyletic clade for length measures from the literature is indicated by a white star at the base of the clade. Shapes to the right of tips indicate whether there is a significant fit with a model of ascending (increasing) tooth size down the molar row. Abbreviations: M, upper molars; m, lower molars.
However, a number of extinct hyracoids are known from associated dentitions, and present an opportunity to generate a suitable phylogenetic bracket that could be applied to other, extinct hyracoid taxa known from isolated teeth. A focus on molars also illustrates one strength of using a phylogenetic bracket to limit potentially interacting sources of variation. Molar crown morphology is often highly heritable, and does not change after eruption during ontogeny, other than change due to tooth wear (Bader 1965; Ungar and Williamson 2000; Polly and Mock 2017). Mammalian molar teeth are not generally sexually dimorphic in shape, although they may be size dimorphic in species that are generally size dimorphic (Wood et al. 1991; Uchida 1998; Miller et al. 2009). Within Hyracoidea specifically, extant and extinct species are weakly sexually dimorphic in cranial size but not in molar shape (Meyer 1973; Yom-Tov 1993). Mandibles and incisors are shape dimorphic, but molars are not known to be (Whitworth 1954; Meyer 1973).
We follow three main steps in evaluating identification criteria and illustrating how they can be used in future studies. First, we statistically test whether the proposed criteria render molar loci distinguishable. Second, we use phylogenetic comparative methods to evaluate whether or not a phylogenetic bracket can be applied to these criteria. Third, we illustrate a hypothetical application of the criteria to an example sample of fossils.
Institutional abbreviations.—AMNH, American Museum of Natural History, New York, USA; CGM, Cairo Geological Museum, Cairo, Egypt; DPC, Duke Lemur Center Museum of Natural History, Duke University, Durham, North Carolina, USA; GSN, Geological Survey of Namibia Museum, Windhoek, Namibia; KNM, National Museums of Kenya, Nairobi, Kenya; MNHN, Muséum National d’Histoire Naturelle, Paris, France; NHMUK, Natural History Museum, London, UK; SMNS, Staatliches Museum für Naturkunde, Stuttgart, Germany; UMZC, University Museum of Zoology, Cambridge, UK; UO, University d’Oran, Algeria; USTL, Université des Sciences et Techniques du Languedoc, Montpellier, France; YPM, Yale Peabody Museum, New Haven, Connecticut, USA.
Other abbraviations.—CVA, canonical variates analysis.
Material and methods
Sampling.—Our sampling made use of publically available data regarding hyrax molars (Tables 1, 2). We searched the repository MorphoSource.org (Boyer et al. 2016) for available micro-CT (µCT) scans of specimens of Hyracoidea with associated teeth, through which molar position could be unambiguously determined (Asher et al. 2017). These specimens consisted of the extant rock hyrax, Procavia capensis, and Eocene–Oligocene specimens from the Fayum, Egypt. The sample of P. capensis includes specimens from Cameroon, Ethiopia, Kenya, South Africa, Sudan, Uganda, and unknown collecting localities. In some cases not all molars in the sequence were preserved, had erupted or remained undamaged enough for a specific type of measurement, resulting in uneven sample sizes of species represented per locus (Table 1). In cases where both the left and right form of a tooth was present in a specimen, we sampled both and took the average of any downstream quantitative measures to reduce the impact of measurement error (Yezerinac et al. 1992; Vitek et al. 2017). We extracted 3D surfaces of each specimen from a µCT scan image stack using Avizo 9.0 software, and exported them in .ply format (FEI Visualization Science Group, Berlin). Directly measured trait data were collected in MeshLab (Cignoni et al. 2008). Specimen numbers are listed in SOM 1 (Supplementary Online Material available at http://app.pan.pl/SOM/app69-Vitek_Princehouse_SOM.pdf, also reposited on Dryad at DOI: 10.5061/dryad.n2z34tn40).
Table 1. Sample sizes of hyracoid molars from MorphoSource.org included in analyses.
|
Species |
m1 |
m2 |
m3 |
M1 |
M2 |
M3 |
|
Geniohyus magnus |
0 |
1 |
1 |
0 |
0 |
0 |
|
Megalohyrax eocaenus |
1 |
1 |
1 |
1 |
1 |
1 |
|
Pachyhyrax crassidentatus |
2 |
2 |
0 |
1 |
1 |
1 |
|
Procavia capensis |
10 |
9 |
5 |
8 |
7 |
3 |
|
Saghatherium antiquum |
2 |
2 |
1 |
0 |
0 |
0 |
|
Saghatherium bowni |
4 |
4 |
2 |
5 |
3 |
2 |
|
Saghatherium humarum |
1 |
1 |
1 |
1 |
1 |
1 |
|
Thyrohyrax domorictus |
2 |
3 |
3 |
1 |
1 |
1 |
|
Thyrohyrax litholagus |
1 |
1 |
1 |
0 |
0 |
0 |
|
Thyrohyrax meyeri |
4 |
4 |
1 |
4 |
3 |
3 |
Table 2. Samples sizes of length and width measurements of hyracoid molars recovered from the published literature and this study.
|
Species |
m1 |
m2 |
m3 |
M1 |
M2 |
M3 |
|
Afrohyrax championi |
4 |
4 |
4 |
4 |
4 |
4 |
|
Afrohyrax namibensis |
0 |
0 |
0 |
2 |
2 |
2 |
|
Antilohyrax pectidens |
6 |
4 |
3 |
3 |
3 |
2 |
|
Brachyhyrax aequatorialis |
0 |
0 |
0 |
1 |
0 |
0 |
|
Bunohyrax fajumensis |
3 |
3 |
2 |
1 |
0 |
0 |
|
Dendrohyrax samueli |
20 |
0 |
0 |
2 |
2 |
2 |
|
Dimaitherium patnaiki |
12 |
14 |
8 |
12 |
7 |
5 |
|
Geniohyus diphycus |
1 |
1 |
0 |
1 |
1 |
1 |
|
Geniohyus magnus |
0 |
0 |
0 |
1 |
2 |
1 |
|
Geniohyus mirus |
1 |
1 |
1 |
1 |
1 |
1 |
|
Heterohyrax auricampensis |
3 |
2 |
1 |
0 |
0 |
0 |
|
Megalohyrax eocaenus |
5 |
5 |
4 |
3 |
3 |
3 |
|
Meroehyrax bateae |
1 |
1 |
2 |
0 |
0 |
0 |
|
Meroehyrax kyongoi |
4 |
3 |
1 |
1 |
2 |
1 |
|
Microhyrax lavocati |
1 |
1 |
1 |
0 |
0 |
0 |
|
Namahyrax corvus |
2 |
2 |
1 |
1 |
1 |
1 |
|
Pachyhyrax crassidentatus |
5 |
5 |
1 |
3 |
4 |
2 |
|
Pliohyrax graecus |
1 |
1 |
0 |
0 |
0 |
0 |
|
Procavia capensis |
9 |
9 |
6 |
8 |
7 |
3 |
|
Procavia pliocenica |
3 |
7 |
3 |
1 |
1 |
1 |
|
Prohyrax hendeyi |
24 |
29 |
42 |
7 |
7 |
11 |
|
Saghatherium antiquum |
11 |
10 |
10 |
1 |
1 |
1 |
|
Saghatherium bowni |
5 |
5 |
3 |
6 |
4 |
3 |
|
Saghatherium humarum |
4 |
4 |
4 |
2 |
2 |
2 |
|
Seggeurius amourensis |
3 |
1 |
1 |
0 |
0 |
0 |
|
Selenohyrax chathrathi |
1 |
1 |
1 |
0 |
0 |
0 |
|
Thyrohyrax domorictus |
3 |
4 |
4 |
12 |
12 |
8 |
|
Thyrohyrax kenyaensis |
2 |
3 |
0 |
2 |
3 |
0 |
|
Thyrohyrax litholagus |
2 |
2 |
1 |
1 |
1 |
1 |
|
Thyrohyrax meyeri |
5 |
5 |
2 |
5 |
4 |
4 |
|
Thyrohyrax microdon |
1 |
0 |
1 |
0 |
0 |
0 |
|
Thyrohyrax pygmaeus |
3 |
4 |
4 |
1 |
1 |
1 |
|
Titanohyrax andrewsi |
4 |
6 |
4 |
1 |
0 |
0 |
|
Titanohyrax angustidens |
2 |
2 |
0 |
1 |
1 |
0 |
In addition, we searched the published literature for reported measurements of fossil hyracoid molars. We hypothesized that the commonly reported length and width measurements might be sufficient to evaluate at least some potentially diagnostic traits (Matsumoto 1921, 1926; Teilhard de Chardin and Licent 1936; Whitworth 1954; Meyer 1973; Sudre 1979; Rasmussen and Simons 1988, 1991, 2000; Court and Mahboubi 1993; Pickford 1994, 2005, 2009; Rasmussen et al. 1996; Tsujikawa and Pickford 2006; Pickford et al. 2008; Rasmussen and Gutierrez 2009; Barrow et al. 2010, 2012; Tabuce 2016; Pickford and Senut 2018). We excluded measurements of specimens assigned to species that were subsequently considered junior synonyms of multiple other species, which meant that species assignment of any particular specimen was unclear (Rasmussen and Gutierrez 2010). Tables of collected measurements are provided in SOM 2.
Traits were each evaluated for their utility as diagnostic indicators of tooth position in the context of intraspecific variation where possible. Ideal sample size was unclear for a study meant to apply to multiple species but focused on between-locus variation. Prior work has shown that for measurements such as lengths and areas, average values can adequately characterize between-locus relationships within a population, and as few as two complete toothrows can accurately represent the mean of between-locus values (Vitek et al. 2020). Prior pilot work supports the use of 1–3 specimens as representative of a species in studies with between-species applications (Gutzwiller and Hunter 2015). However, other studies focused on within-species variation required sample sizes >5 (Polly 2003). Given this uncertainty, we did not impose sample size limitations on taxa. Future work could more directly test the relationship between optimum sample size and within-species levels of variation for similar studies.
Trait choice.—We developed a list of potentially locus-diagnostic traits based on a review of hyracoid-specific differences in molar position size and shape, as well as differences documented more broadly in Eutheria. Increase in relative tooth size was previously proposed to differentiate molar loci of hyracoids (Seiffert 2007; Barrow 2011). To test hypotheses that some aspect of relative crown size differentiated loci, we collected length data from each tooth. From those measurements we calculated a ratio of tooth length relative to the length of the first molar (m1 or M1) in the tooth row. A second proposed trait from the literature is that the width of the trigonid decreases down the lower molar row in many, though not all, eutherians (Butler 1939; Novacek et al. 1985; Kondo et al. 1994). We wanted to test the utility of this trait, but did not want to develop measurements that could only be observed in pristine, unworn specimens because such measurements would have limited applicability. We therefore operationalized relative trigonid width as trigonid base width divided by talonid base width (Fig. 2).
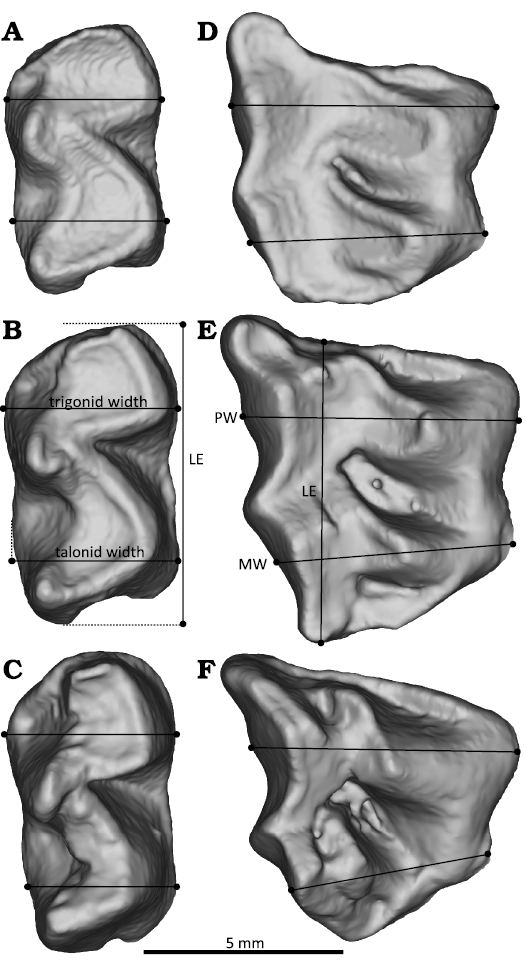
Fig. 2. Illustration of measurements taken on lower (m1–m3, A–C) and upper (M1–M3, D–F) teeth in occlusal views to calculate potentially diagnostic traits. Measurements are illustrated on specimen UMZC H5101A, Procavia capensis. Abbreviations: LE, length; MW, width of the crown at metaloph; PW width of the crown at paraloph.
Variation in traits between loci of upper and lower molar rows covaries, providing an additional potential line of evidence for choosing diagnostic traits (Butler 1937; Gómez-Robles and Polly 2012). For example, the upper molar lophs measured here occlude with lophids that intersect with points of maximum width of the trigonid and talonid on lower molars (Janis 1979; Gheerbrant et al. 2016). These lophs and lophids covary in shape because of their functional, occluding relationship (Marshall and Butler 1966). If trigonid width were potentially diagnostic for lower molar positions, the occluding metaloph width might be diagnostic for upper molar positions. To better understand what might be diagnostic about changing upper molar proportions, we tested three potential traits: the ratios of width of the crown at paraloph level relative to crown length, width of the crown at metaloph level relative to crown length, and the length of each tooth relative to M1 length in the same toothrow. To measure the lengths of these lophs while trying to avoid the influence of tooth wear changing the apparent position of cusp tips on the crown, lophs were measured in terms of their maximum transverse length, or the distance from the lingual border of one cusp to the lingual border of its buccolingual pair.
Measurement and analysis.—First, we tested for significant difference in trait values between tooth loci using analysis of variance (ANOVA). We included a term for species along with tooth locus in the model, as well as an interaction effect between the two to test the hypothesis that differences between loci may themselves evolve, resulting in species-specific differences (or lack thereof) between tooth loci.
A common next step would be a canonical variates analysis (CVA) or similar classification test (Bookstein 2018). However, in this study such an approach applied to the entire sample as a single unit would be inappropriate because of the possibility that the trait value relationships between loci evolves. CVA models a constant, unchanging relationship between loci regardless of species identity. Evolution resulting in species-specific linear relationships could not be accurately captured in a single linear model. In three species for which standard deviations could be estimated for all three tooth loci for all measurements, we conducted species-specific CVA using the “MASS” package (Venables and Ripley 2002) to test the utility of these metrics for species-specific locus classification. Input variables were length of each tooth, which served as a measure of size, and a ratio describing relative width of each tooth. For lower molars, the ratio was relative trigonid width. For upper molars, the ratio was width at the paraloph divided by width at the metaloph. Ratios were preferable to absolute values because the ratios remove information about size, helping prevent the results from being the consequence of size alone. Such a result would not fulfill the goal because it has already been shown that size is not a sufficient source of evidence for tooth position (Pickford 1994). Leave-one-out cross-validation was used to as an assessment of the model’s ability to accurately classify loci within species.
A more complex classification analysis of the entire sample, like classification and regression trees (CART), and other various machine learning or classification analyses were also not ideal in this case, despite their statistical power (Kuhn and Johnson 2013). They require complete enumeration of possible species in the sample, which is not known in cases where locus identification is a step in determining number of species. An approach that relies on knowing this information would not have achieved our goal of developing criteria that could be used in the absence of knowledge about species identity.
Instead, we assessed the reliability of a more conservative set of relationships, given the potential for species-specific differences in exact degree of difference between tooth locus. First, we assessed the degree to which all species followed a single ascending-descending developmental model based on preliminary visual assessment of the data and knowledge of mammalian tooth development (Polly 2007; Young et al. 2015). These models predict that developmental modules, such as a molar tooth field, share covariance relationships with a racheting effect, even if the exact developmental mechanism is unknown (Kavanagh et al. 2007; Polly 2007). We assessed the degree to which hyracoids share a single overarching developmental pattern by examining consistency in the directionality of trait value differences down the molar row. We calculated the number of taxa that did not share this relationship as a simple proportion out of the total number of species.
Then, we assessed the consistency with which molar loci significantly differed using a particular trait from one taxon. We modeled the distribution of each trait for each tooth position as a normal distribution, lacking information to support use of an alternative distribution (Jaynes and Bretthorst 2003). We used variation in the best-sampled taxon, P. capensis, as a model for standard deviation that we applied to all taxa and tooth positions. We thought it appropriate to apply measures of variation from one taxa to other taxa because in studies of other clades, within-clade variation in variance is relatively low (Gingerich and Schoeninger 1979). We chose the sample of P. capensis as a model because as large a sample size as possible would better represent the true amount of variation in an underlying population. The large geographic scope of sampling of the P. capensis sample makes it more likely to be an overestimate rather than an underestimate of the true variance in other hyracoid taxa. We also considered that an overestimate of variation was a more conservative and better error to make in this case than an underestimate of variation. For each species, we z-transformed the differences between traits among subsequent pairs of loci (first molar versus second molar, second molar versus third molar) by taking the difference between the two per-locus mean values and dividing by the P. capensis standard deviation for the latter molar. Given this model of trait values as a standard normal distribution, we then calculated the probability of finding a larger z-value given the hypothesis that the two locus means were actually drawn from the same distribution. We report those probability values as p-values. The underlying hypothesis being tested is that most of these tests will have significant p-values, and therefore it was appropriate to correct p-values for each batch of species-specific tests for each measurement using a Benjamini-Hochberg false discovery rate test (Benjamini and Hochberg 1995; Bender and Lange 2001). All analyses were conducted in R version 4.3.1 (R Core Team 2015), and copies of scripts as used are included in supplementary data.
Phylogenetic conservatism.—Testing the hypothesis of phylogenetic conservatism in locus-specific trait values was required before using a phylogenetic bracket to apply values to poorly known species. Two different phylogenetic comparative methods were used to test two slightly different hypotheses. The first, Blomberg et al.’s K is a standard measure of phylogenetic signal in continuous, univariate traits (Blomberg et al. 2003). A value significantly greater than 1 indicates significant phylogenetic retention, a specific form of conservatism in which trait values change less than expected for a Brownian-motion model of trait evolution (Cooper et al. 2010). We estimated Blomberg et al.’s K for ratio values using the phylogenetic relationships between hyracoids recovered by the most recent published phylogenetic analysis (Cooper et al. 2014). This topology does not include all measured hyracoids. An expanded phylogenetic analysis is beyond the scope of this particular study, but is part of ongoing research. We used tip dates listed in SOM 1: table 1 (Matsumoto 1921, 1926; Sudre 1979; Drake et al. 1988; Rasmussen and Simons 1988, 1991, 2000; Feibel and Brown 1991; Pickford 1994, 2009; Seiffert 2006; Tsujikawa and Pickford 2006; Pickford et al. 2008; Barrow et al. 2010; Rasmussen and Gutierrez 2010; Leakey et al. 2011; Coster et al. 2012; Cote et al. 2018; Walker 2019; Heritage and Seiffert 2022) and a root age of 70.1 million years (Heritage et al. 2021; Heritage and Seiffert 2022) to scale branches and randomly resolved polytomies using the “RRphylo” package (Castiglione et al. 2021).
However, our interest was not in the conservatism of a specific set of trait values, but rather conservatism in the pattern of relationships between loci. That is, we were interested in testing for significant phylogenetic retention in the categorical state of the m2 being significantly longer than the m1, and other similar traits. Two metrics exist for evaluating phylogenetic signal in categorical data. The first, Cooper’s D, does not perform well in cases of high trait prevalence, or when a high proportion of taxa all share one character state, which was the case for our observed traits (Fritz and Purvis 2010). The second, Borges et al.’s δ, may be appropriate to the hypothesis, but its properties in cases of phylogenetic retention have not yet been explored to our knowledge (Borges et al. 2019). We decided to explore the properties of Borges et al.’s δ under simulated models of phylogenetic retention to see if it could be used in a statistical test.
In its original development, δ is calculated based on estimates of ancestral states in a phylogenetic tree with a distribution of tip values. The δ value is higher when there is less entropy, or more information, or less uncertainty, in estimates of ancestral states. Possible values of δ have no theoretical upper bound. Instead, the original approach tests for the existence of phylogenetic signal by comparing the observed δ to a distribution of δ estimated from randomly shuffling trait values between tips, simulating a case of no phylogenetic signal (Borges et al. 2019). Such a test would not be informative in differentiating a case of phylogenetic retention from phylogenetic signal fitting a model of Brownian motion. In the case of phylogenetic retention of categorical traits, more tips have the same character states than expected from a hypothesis of trait evolution by Brownian motion. Shuffling a nearly invariant trait among tips would not result in a test of an alternative model. The null hypothesis in this case contains phylogenetic signal, so comparing observed results to a test of no phylogenetic signal also does not provide an adequate test. In the scenario of retention, δ should be high because there is little uncertainty in the ancestral state estimate of an invariant or nearly invariant character, but it is not clear if it will result in a higher value than the range of values produced by phylogenetic signal of evolution following Brownian motion along a topology.
An appropriate test would be comparison of a null hypothesis of trait evolution by Brownian motion versus an alternative hypothesis of trait retention. The two hypotheses should differ in the character states observed, not just the distribution of states across tips. Therefore, we explored the behavior of Borges et al.’s δ (Borges et al. 2019) under this testing model. To do so, we used the empirical topology of Cooper et al. (2014) as described above. On this topology we simulated binary character evolution under a model of Brownian motion 1000 times to generate a distribution of character states and associated Borges et al.’s δ values that fit the null hypothesis (Borges et al. 2019). To provide an indication of the probability that any of our observed trait distributions could have come from this null model, we calculated the number of simulations that (i) produced δ equal to or larger than the observed value, and (ii) had as many or more taxa with the derived state of the binary character compared to the observed value. Each of these proportions is presented as p-values.
To explore the expected behavior of δ in cases of phylogenetic retention, we iteratively made each simulation more and more similar to a case of character invariance. For each simulation, from root to tip, we changed one tip value to the derived character state, then re-calculated Borges et al.’s δ. We repeated this process until all but one tip had the derived character state, which models the maximum amount of phylogenetic retention possible because the statistic cannot be calculated for an invariant character. We compared our observed result to this set of simulations graphically. We conducted all phylogenetic comparative analyses only for the relative length proportions because these values could be calculated from a larger number of tips on the tree. Other proportions were only calculated for 10 or fewer tips, and in that situation δ does not produce reliable estimates (Borges et al. 2019).
Case study.—We chose the lower molars of Meroehyrax kyongoi from the sites of Losodok (Lothidok) and Nakwai in the Turkana Basin, Kenya in the Turkana Basin, Kenya (Rasmussen and Gutierrez 2009) as a case study for three main reasons. First, they represent a realistic challenge, because the authors noted that without the late discovery of an associated dentition, the assignment of the isolated tooth fossils to position would have been much more tentative (Rasmussen and Gutierrez 2009). Second, these fossils are described in the only hyracoid publication we could find that reported both trigonid and talonid width measures, permitting us to use the full range of diagnostic criteria. Third, they represent realistic examples in the fossil record where some minimum level of variation can be investigated, but sample size is too small for investigation by machine learning or other promising methods (Chicco 2017). We analyzed only the lower molars because the upper molars only had three teeth with complete reported measurements (Rasmussen and Gutierrez 2009). In Meroehyrax kyongoi, the m3 has a distinctly expanded hypoconulid, making isolated m1s and m2s most difficult to distinguish, like in many other hyracoid species (Rasmussen and Gutierrez 2009).
We applied trait relationships that showed evidence of phylogenetic conservatism to this sample. If specific continuous ratio values showed conservatism, we applied those directly to the sample. If more categorical patterns for indices showed conservatism, we plotted relevant measures in bivariate plots, then visually inspected the plots for clusters of specimens that showed congruence with categorical patterns for both indices.
Results
Lower molar locus differentiability.—The two traits, length relative to m1 length and trigonid width relative to talonid width, appear to differentiate tooth loci (Fig. 3) and significantly differ between tooth positions in the directly-measured sample (Table 3). Species also differ significantly in relative length of tooth positions in the larger sample of literature-derived measurements (Table 4). The published measurements were not sufficient to assess potential differences in relative trigonid width for almost all taxa. In both the directly-measured and literature-derived samples, relative length has a significant interaction with species identity (Tables 3, 4).
Table 3. Results of ANOVAs testing differences in univariate metrics between molar loci of hyracoids. Significant p-values are in bold. Abbreviations: df, degrees of freedom; F, F values; p, p-values; SS, sum of squares.
|
Molar row |
Trait |
Variable |
df |
SS |
F |
p |
|
Lower |
length : |
trait |
1 |
20.545 |
151.983 |
<0.001 |
|
species |
8 |
2.635 |
2.437 |
0.027 |
||
|
interaction |
8 |
7.362 |
6.807 |
<0.001 |
||
|
trigonid width : talonid width |
trait |
1 |
21.555 |
141.017 |
<0.001 |
|
|
species |
8 |
5.668 |
2.632 |
0.014 |
||
|
interaction |
8 |
1.870 |
0.869 |
0.5587 |
||
|
Upper |
length : |
trait |
1 |
17.740 |
59.493 |
<0.001 |
|
species |
6 |
2.015 |
1.126 |
0.367 |
||
|
interaction |
6 |
0.890 |
0.498 |
0.806 |
||
|
paraloph width : length |
trait |
1 |
0.837 |
1.261 |
0.269 |
|
|
species |
6 |
2.458 |
0.618 |
0.715 |
||
|
interaction |
6 |
4.183 |
1.051 |
0.410 |
||
|
metaloph width : length |
trait |
1 |
9.866 |
27.880 |
<0.001 |
|
|
species |
6 |
8.326 |
3.921 |
0.004 |
||
|
interaction |
6 |
0.448 |
0.211 |
0.97 |
||
|
paraloph : metaloph width |
trait |
1 |
15.37 |
38.95 |
<0.001 |
|
|
species |
6 |
8.326 |
3.921 |
0.030 |
||
|
interaction |
6 |
0.448 |
0.211 |
0.971 |
Table 4. Results of ANOVAs testing differences in relative lengths between molar loci of hyracoids, based on values from the published literature. Significant p-values are in bold. Abbreviations: df, degrees of freedom; F, F values; p, p-values; SS, sum of squares.
|
Molar row |
Trait |
Variable |
df |
Sum of squares |
F |
p |
|
Lower |
length : |
trait |
1 |
175.92 |
1169.05 |
<0.001 |
|
species |
31 |
13.22 |
2.83 |
<0.001 |
||
|
interaction |
31 |
16.70 |
3.58 |
<0.001 |
||
|
Upper |
length : |
trait |
1 |
64.09 |
187.86 |
<0.001 |
|
species |
28 |
9.53 |
1.00 |
0.476 |
||
|
interaction |
25 |
14.71 |
1.73 |
0.023 |
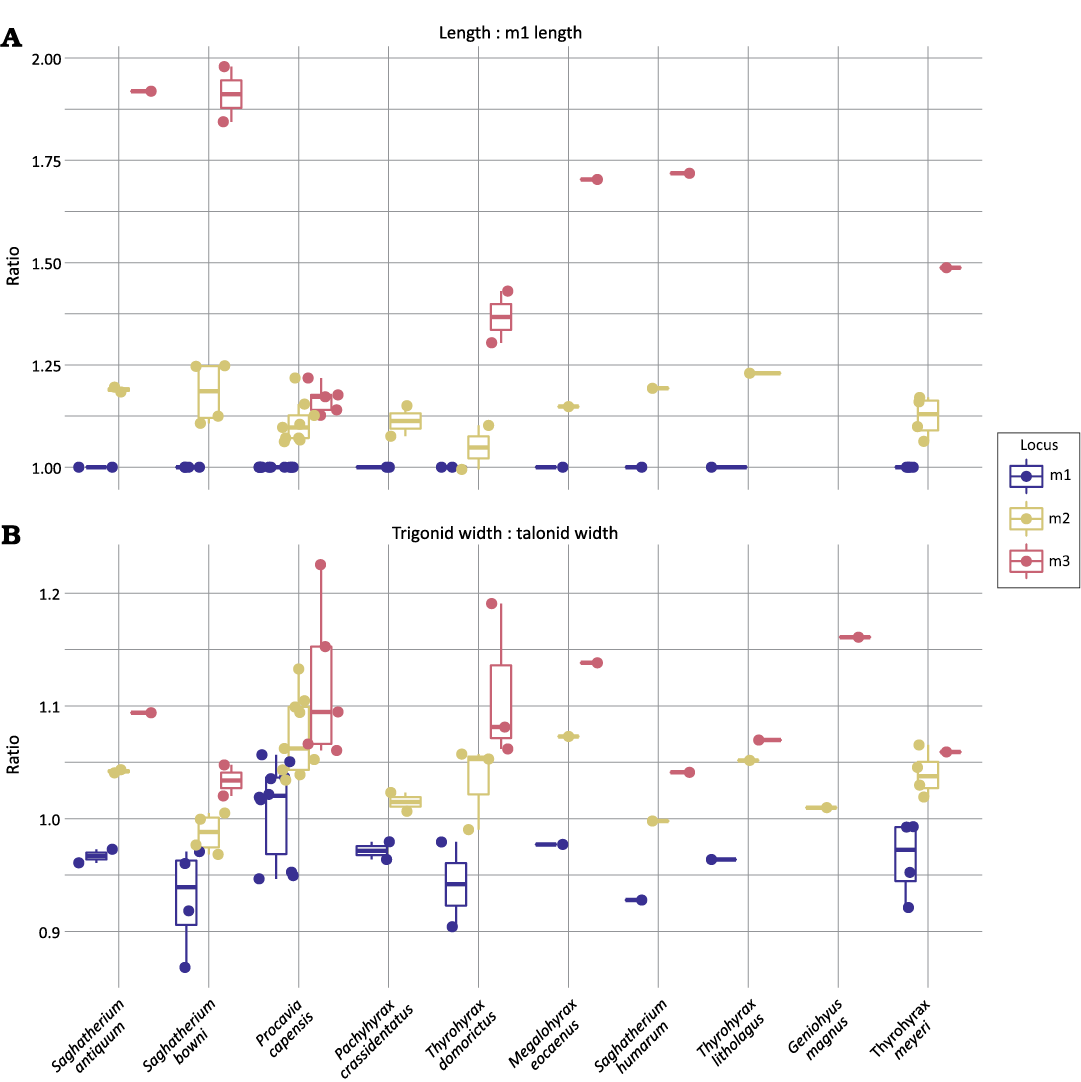
Fig. 3. Distribution of values for a set of univariate, potentially locus-diagnostic traits (A, length vs. m1 length; B, trigonid width vs. talonic width) described in Fig. 2 in lower molars of a range of hyracoid species.
The standard deviation in both trait values for each tooth position is listed in Table 5. Mean trait values consistently increased down the tooth row in both traits for all species measured in this study (Table 6), but length did not consistently increase for all species with published measurements in the literature (Table 7). Procavia pliocenica and Seggurius amourensis both had smaller reported m2s than m1s. Traits did not always differ significantly between loci when using modeled standard deviation and a significance threshold of p = 0.05 (Table 6). First and second molars often differed in relative trigonid widths, but second and third molars rarely did. Both pairs of molars frequently, but not universally, differed in relative length.
Table 5. Standard deviation of potentially locus-diagnostic traits in Procavia capensis.
|
Molar row |
Trait |
m1 |
m2 |
m3 |
|
Lower |
length : m1 length |
NA |
0.0515 |
0.0355 |
|
trigonid width : talonid width |
0.0427 |
0.0350 |
0.0693 |
|
|
Upper |
length : M1 length |
NA |
0.0247 |
0.0441 |
|
metaloph width : length |
0.0516 |
0.0436 |
0.0353 |
|
|
paraloph : metaloph width |
0.0573 |
0.1016 |
0.0716 |
Table 6. Mean locus differences and associated p-values in trait values for lower molars of hyracoids. NA values indicate that at least one necessary tooth locus was not available to measure. Significance values are corrected by a false-discovery rate correction, and those <0.05 are in bold.
|
Species |
Length : m1 length |
Trigonid width : talonid width |
||||||||
|
m1 |
m2 |
m3 |
m1 vs. m2 |
m2 vs. m3 |
m1 |
m2 |
m3 |
m1 vs. m2 |
m2 vs. m3 |
|
|
Geniohyus magnus |
NA |
NA |
NA |
NA |
NA |
NA |
1.01 |
1.161 |
NA |
0.0711 |
|
Megalohyrax eocaenus |
1 |
1.148 |
1.703 |
0 |
0 |
0.977 |
1.073 |
1.138 |
0.0294 |
0.3163 |
|
Pachyhyrax crassidentatus |
1 |
1.113 |
NA |
0.0004 |
NA |
0.972 |
1.015 |
NA |
0.1272 |
NA |
|
Procavia capensis |
1 |
1.108 |
1.167 |
0.0025 |
0.02 |
1.009 |
1.074 |
1.12 |
0.0699 |
0.3163 |
|
Saghatherium antiquum |
1 |
1.19 |
1.919 |
0 |
0 |
0.967 |
1.042 |
1.094 |
0.0421 |
0.3163 |
|
Saghatherium bowni |
1 |
1.182 |
1.912 |
0 |
0 |
0.929 |
0.987 |
1.034 |
0.0699 |
0.3163 |
|
Saghatherium humarum |
1 |
1.193 |
1.718 |
0 |
0 |
0.928 |
0.998 |
1.041 |
0.0477 |
0.3163 |
|
Thyrohyrax domorictus |
1 |
1.048 |
1.367 |
0.0725 |
0 |
0.942 |
1.034 |
1.111 |
0.0294 |
0.3163 |
|
Thyrohyrax litholagus |
1 |
1.23 |
NA |
0 |
NA |
0.964 |
1.052 |
1.07 |
0.0294 |
0.3868 |
|
Thyrohyrax meyeri |
1 |
1.123 |
1.488 |
0.0002 |
0 |
0.965 |
1.04 |
1.059 |
0.0421 |
0.3868 |
Three species, Procavia capensis, Saghatherium bowni, and Thyrohyrax domorictus, had a minimum sample size needed to estimate a standard deviation for all three loci, and therefore perform a CVA within each species. Visualization of overlap in trait values between loci (Fig. 4) matched different levels of classification accuracy between species (Table 8). All models were significantly more accurate than their associated no-information rate (p < 0.03). The no-information rate is calculated based on the category with the highest proportion of predicted specimens out of the total dataset. For example, the no-information rate for lower molars of Procavia capensis is 0.375, based on the model predicting 9 teeth to be m1 and 9 teeth being predicted to be m2, out of a total of 24 teeth. The model for Procavia capensis had relatively low classification accuracy, consistent with wide overlap in values between loci. In contrast, models for Saghatherium bowni and Thyrohyrax domorictus accurately classified all but one specimen each.
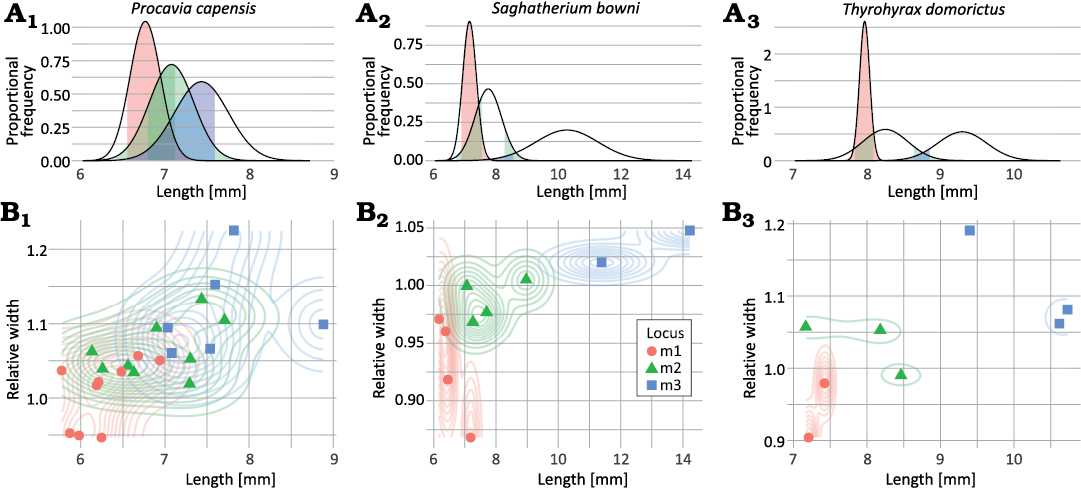
Fig. 4. Overlap in potentially diagnostic trait values for lower molar loci of three example hyracoid taxa (A1, B1, Procavia capensis; A2, B2, Saghatherium bowni; A3, B3, Thyrohyrax domorictus). A. Length vs. proportional frequency, showing how a single trait, length, would be modeled in a univariate discriminant analysis using observed means and variances. Colored sections of the distributions show length values that are within 95% confidence intervals of the means of more than one tooth locus, indicating regions of ambiguous lengths. B. Length vs. relative width, showing scatter plots overlaid on 2D density diagrams showing the distribution of values for individual teeth.
Upper molar locus differentiability.—Of the four traits, three visually differentiate tooth loci and significantly differ between tooth loci: length relative to M1 length, relative metaloph to paraloph width, and metaloph width relative to length (Fig. 5, Table 3). Paraloph width relative to length did not differ significantly between loci in the sample and was not considered further. A larger sample of species drawn from the literature also differ significantly in relative length of tooth positions (Table 4). Measurements from the literature were not sufficient to assess other potentially diagnostic traits, similar to limitation on lower molar relative trigonid widths. In the larger sample from the literature, relative length has a significant interaction with species identity.
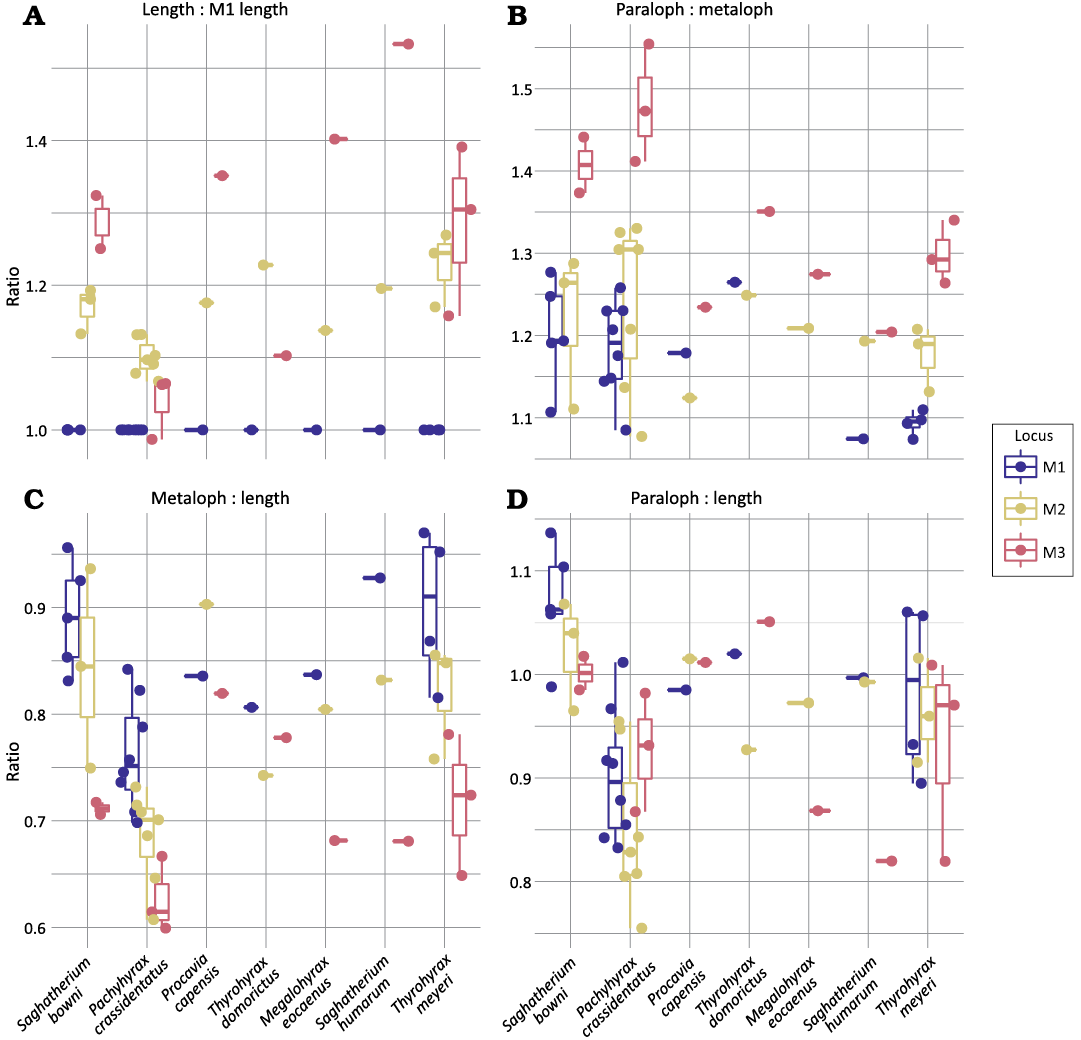
Fig. 5. Distribution of values for a set of univariate, potentially locus-diagnostic traits (A, length vs. M1 length; B, paraloph vs. metaloph; C, metaloph vs. length; D, paraloph vs. length) described in Fig. 2 in upper molars of a range of hyracoid species.
Variance in both trait values for each tooth position is listed in Table 5. Mean trait values for relative length and relative width generally, but not universally, increased down the molar row (Tables 7, 9). In six species, Dendorhyrax samueli, Meroehyrax kyongoi, Procavia capensis, Procavia pliocenica, Thyrohyrax domorictus, and Thyrohyrax pygmaeus, the M3 was shorter than the M2. The M2 was consistently significantly longer than the M1 across species, but the M3 was rarely significantly longer than the M2. The width of the metaloph relative to paraloph width generally decreased down the tooth row, but rarely to a significant degree. Metaloph width relative to crown length did not differ significantly between positions for any taxon.
Table 7. Lengths of second and third molars relative to the length of the first molars from previously published sources. Mean values are given in the first two columns for each arcade (by definition the first molar has a relative length to itself of 1, and is therefore not listed). Modeled significance of those differences are given in the next two columns. Significance values are corrected by a false-discovery rate correction, and those <0.05 are in bold. Relative length values that indicate divergence from an ascending-descending model of tooth sizes, are underlined. Abbreviations: C, fit to an ascending (A, increasing size) or descending (D, decreasing size) cascade model down the molar row, or to neither (N); NA, not applicable because none observed; p, p-value, ?, fit could not be evaluated because of missing data.
|
Species |
mean |
|
p |
|
C |
mean |
|
p |
|
C |
|
m2 |
m3 |
m1 vs. m2 |
m2 vs. m3 |
|
M2 |
M3 |
M1 vs. M2 |
M2 vs. M3 |
|
|
|
Afrohyrax championi |
1.11 |
1.5 |
0.0007 |
0 |
A |
1.085 |
1.175 |
0.0004 |
0.0364 |
A |
|
Afrohyrax namibensis |
NA |
NA |
NA |
NA |
? |
1.05 |
1.257 |
0.0224 |
0 |
A |
|
Antilohyrax pectidens |
1.153 |
1.53 |
0 |
0 |
A |
1.17 |
1.26 |
0 |
0.0364 |
A |
|
Brachyhyrax aequatorialis |
NA |
NA |
NA |
NA |
? |
NA |
NA |
NA |
NA |
? |
|
Brachyhyrax oligocenus |
NA |
NA |
NA |
NA |
? |
1.075 |
1.204 |
0.0013 |
0.0049 |
A |
|
Bunohyrax fajumensis |
1.191 |
1.897 |
0.0009 |
0 |
A |
NA |
NA |
NA |
NA |
? |
|
Bunohyrax major |
1.188 |
1.835 |
0 |
0 |
A |
NA |
NA |
NA |
NA |
? |
|
Dendrohyrax samueli |
NA |
NA |
NA |
NA |
? |
1.187 |
1 |
0 |
1 |
N |
|
Dimaitherium patnaiki |
1.198 |
1.676 |
0 |
0 |
A |
1.194 |
1.23 |
0 |
0.2803 |
N |
|
Geniohyus diphycus |
1.108 |
NA |
0.0008 |
NA |
? |
1.133 |
1.185 |
0 |
0.1828 |
N |
|
Geniohyus magnus |
NA |
NA |
NA |
NA |
? |
1.182 |
1.318 |
0 |
0.0033 |
A |
|
Geniohyus mirus |
1.17 |
1.769 |
0 |
0 |
A |
1.181 |
1.219 |
0 |
0.2796 |
N |
|
Heterohyrax auricampensis |
1.043 |
1.059 |
0.1028 |
0.3392 |
N |
NA |
NA |
NA |
NA |
? |
|
Megalohyrax eocaenus |
1.187 |
1.699 |
0 |
0 |
A |
1.153 |
1.389 |
0 |
0 |
A |
|
Meroehyrax bateae |
1.05 |
1.515 |
0.0717 |
0 |
A |
NA |
NA |
NA |
NA |
? |
|
Meroehyrax kyongoi |
1.082 |
1.288 |
0.0074 |
0 |
A |
1.198 |
1.194 |
0 |
0.649 |
N |
|
Microhyrax lavocati |
1.135 |
1.25 |
0 |
0.0007 |
A |
NA |
NA |
NA |
NA |
? |
|
Namahyrax corvus |
1.135 |
1.52 |
0 |
0 |
A |
1.184 |
1.253 |
0 |
0.0968 |
N |
|
Pachyhyrax crassidentatus |
1.108 |
1.646 |
0.0008 |
0 |
A |
1.176 |
1.269 |
0 |
0.0364 |
A |
|
Pliohyrax graecus |
1.112 |
NA |
0.0005 |
NA |
? |
NA |
NA |
NA |
NA |
? |
|
Procavia capensis |
1.104 |
1.223 |
0.0011 |
0.0005 |
A |
1.083 |
1.034 |
0.0005 |
0.9492 |
N |
|
Procavia pliocenica |
0.989 |
0.978 |
0.6526 |
0.6216 |
N |
1.027 |
0.959 |
0.1372 |
0.9811 |
N |
|
Prohyrax hendeyi |
1.162 |
1.876 |
0 |
0 |
A |
1.156 |
1.643 |
0 |
0 |
A |
|
Saghatherium antiquum |
1.179 |
1.766 |
0 |
0 |
A |
1.182 |
1.273 |
0 |
0.0364 |
A |
|
Saghatherium bowni |
1.188 |
1.9 |
0 |
0 |
A |
1.132 |
1.302 |
0 |
0.0005 |
A |
|
Saghatherium humarum |
1.207 |
1.704 |
0 |
0 |
A |
1.161 |
1.421 |
0 |
0 |
A |
|
Seggeurius amourensis |
0.933 |
1.377 |
0.979 |
0 |
N |
NA |
1.204 |
NA |
NA |
? |
|
Selenohyrax chathrathi |
1.22 |
1.864 |
0 |
0 |
A |
NA |
NA |
NA |
NA |
? |
|
Thyrohyrax domorictus |
1.089 |
1.429 |
0.0041 |
0 |
A |
1.124 |
1.121 |
0 |
0.649 |
N |
|
Thyrohyrax kenyaensis |
1.095 |
NA |
0.0025 |
NA |
? |
1.119 |
NA |
0 |
NA |
? |
|
Thyrohyrax litholagus |
1.234 |
1.902 |
0 |
0 |
A |
1.165 |
1.308 |
0 |
0.0023 |
A |
|
Thyrohyrax meyeri |
1.126 |
1.567 |
0.0002 |
0 |
A |
1.198 |
1.29 |
0 |
0.0364 |
A |
|
Thyrohyrax microdon |
NA |
1.582 |
NA |
NA |
? |
NA |
NA |
NA |
NA |
? |
|
Thyrohyrax pygmaeus |
1.115 |
1.507 |
0.0004 |
0 |
A |
1.113 |
1.071 |
0 |
0.9492 |
N |
|
Titanohyrax andrewsi |
1.101 |
1.633 |
0.0014 |
0 |
A |
NA |
NA |
NA |
NA |
? |
|
Titanohyrax angustidens |
1.246 |
NA |
0 |
NA |
? |
1.202 |
NA |
0 |
NA |
? |
Table 9. Mean locus differences and associated p-values in trait values for upper molars of hyracoids. NA values indicate that at least one necessary tooth locus was not available to measure. Significance values are corrected by a false-discovery rate correction, and those <0.05 are in bold. Underlined values indicate those that do not follow the ascending-descending relationship of the rest of the dataset.
|
Species |
Length : M1 length |
Paraloph : metaloph width |
Metaloph width : length |
||||||||||||
|
M1 |
M2 |
M3 |
M1 vs. M2 |
M2 vs. M3 |
M1 |
M2 |
M3 |
M1 vs. M2 |
M2 vs. M3 |
M1 |
M2 |
M3 |
M1 vs. M2 |
M2 vs. M3 |
|
|
Megalohyrax eocaenus |
1 |
1.137 |
1.402 |
0 |
0.2122 |
NA |
1.209 |
1.274 |
NA |
0.2122 |
0.837 |
0.804 |
0.681 |
0.9862 |
1 |
|
Pachyhyrax crassidentatus |
1 |
1.176 |
1.351 |
0 |
0.1079 |
1.179 |
1.124 |
1.234 |
0.7059 |
0.1079 |
0.836 |
0.903 |
0.819 |
0.4354 |
1 |
|
Procavia capensis |
1 |
1.1 |
1.038 |
0 |
0.0028 |
1.185 |
1.241 |
1.48 |
0.5814 |
0.0028 |
0.762 |
0.685 |
0.627 |
0.9862 |
1 |
|
Saghatherium bowni |
1 |
1.169 |
1.287 |
0 |
0.0165 |
1.203 |
1.221 |
1.407 |
0.6446 |
0.0165 |
0.891 |
0.844 |
0.712 |
0.9862 |
1 |
|
Saghatherium humarum |
1 |
1.196 |
1.533 |
0 |
0.4389 |
1.074 |
1.193 |
1.204 |
0.5814 |
0.4389 |
0.928 |
0.832 |
0.681 |
0.9862 |
1 |
|
Thyrohyrax domorictus |
1 |
1.228 |
1.103 |
0 |
0.1079 |
1.265 |
1.249 |
1.351 |
0.6751 |
0.1079 |
0.806 |
0.742 |
0.778 |
0.9862 |
1 |
|
Thyrohyrax meyeri |
1 |
1.228 |
1.285 |
0 |
0.1001 |
1.094 |
1.176 |
1.299 |
0.5814 |
0.1001 |
0.901 |
0.82 |
0.718 |
0.9862 |
1 |
Three species, Procavia capensis, Saghatherium bowni, and Thyrohyrax meyeri, had a minimum sample size needed to estimate a standard deviation for all three loci, and therefore perform a CVA within each species. None of the three models were able to classify specimens more more accurately than the no-information rate (Table 8, Fig. 6). It is possible that these results were due to small sample sizes in Saghatherium bowni and Thyrohyrax meyeri, although sample sizes don’t differ much between upper and lower molars of Saghatherium bowni.
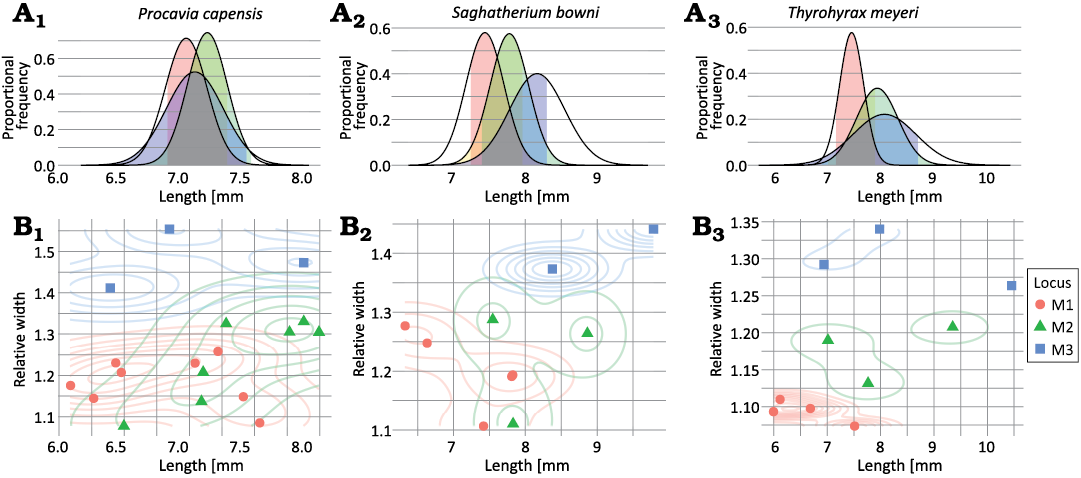
Fig. 6. Overlap in potentially diagnostic trait values for upper molar loci of three example hyracoid taxa (A1, B1, Procavia capensis; A2, B2, Saghatherium bowni; A3, B3, Thyrohyrax meyeri). A. Length vs. proportional frequency, showing how a single trait, length, would be modeled in a univariate discriminant analysis using observed means and variances. Colored sections of the distributions show length values that are within 95% confidence intervals of the means of more than one tooth locus, indicating regions of ambiguous lengths. B. Length vs. relative width, showing scatter plots overlaid on 2D density diagrams showing the distribution of values for individual teeth.
Table 8. Results of linear discriminant analysis for selected species; p-values assess null hypothesis that the accuracy is less than or equal to the no-information rate.
|
Species |
Molar row |
No-information rate |
Accuracy |
p-value |
|
Procavia capensis |
lower |
0.375 |
0.583 |
0.0307 |
|
Saghatherium bowni |
lower |
0.4 |
0.9 |
0.0017 |
|
Thyrohyrax domorictus |
lower |
0.375 |
0.875 |
0.0056 |
|
Procavia capensis |
upper |
0.444 |
0.611 |
0.1181 |
|
Saghatherium bowni |
upper |
0.5 |
0.7 |
0.1719 |
|
Thyrohyrax meyeri |
upper |
0.4 |
0.7 |
0.0539 |
Phylogenetic conservatism.—Continuous ratio values of relative widths contained phylogenetic signal not significantly different from that expected under Brownian motion, with only one exception (Table 10). The relative widths of the upper third molar showed a signal of phylogenetic retention.
Simulations produced a wide range of Borges et al.’s δ values (Fig. 7), similar to the range previously documented for other simulations (Borges et al. 2019). The distribution of δ produced by simulations of Brownian motion appeared to be unimodal, right skewed and spread across a range of character frequencies. As simulations increased in amount of phylogenetic retention, the average value of δ also appeared to increase, but only slightly compared to the range of δ values. The distribution of simulated δ values also become more strongly bimodal as retention increased. Values of δ finally converged on a much narrower range of values when all but one tip had the derived character state.
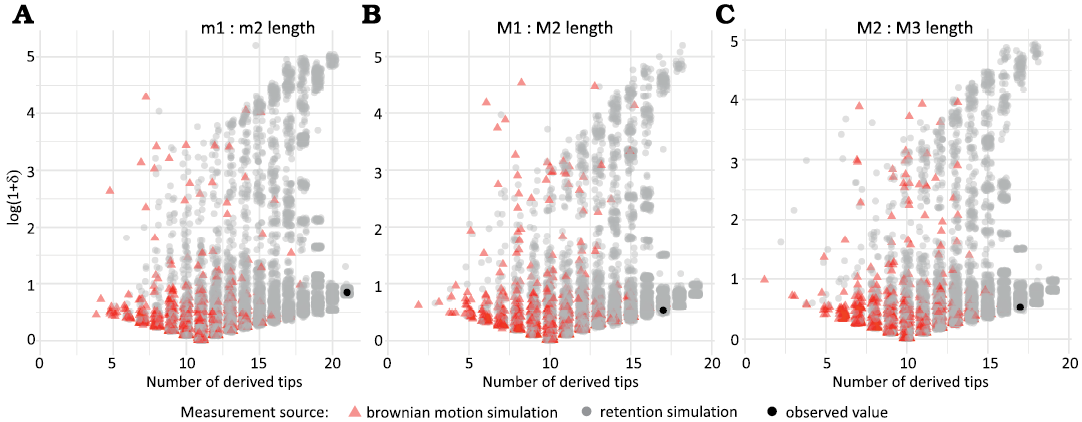
Fig. 7. Simulated and observed values of Borges et al.’s (Borges et al. 2019) δ values for simulated trait distributions on the tree in Fig. 1 for sets of traits (A, m1 : m2 length; B, M1 : M2 length; C, M2 : M3 length) that show phylogenetic signal (red triangles) and phylogenetic retention (gray circles).
Table 10. Results of phylogenetic comparative analysis of Blomberg et al.’s (Blomberg et al. 2003) K; p-values assess likely difference from null hypothesis that the trait evolved under Brownian motion.
|
Measurement |
K |
p-value |
|
m2 : m1 length, all tips |
1.396 |
0.145 |
|
m3 : m2 length, all tips |
0.895 |
0.0879 |
|
m1 relative widths, all tips |
0.644 |
0.477 |
|
m2 relative widths, all tips |
0.574 |
0.568 |
|
m3 relative widths, all tips |
0.514 |
0.608 |
|
M2 : M1 length, all tips |
0.633 |
0.118 |
|
M3 : M2 length, all tips |
0.331 |
0.775 |
|
M1 relative widths, all tips |
0.237 |
0.959 |
|
M2 relative widths, all tips |
0.600 |
0.657 |
|
M3 relative widths, all tips |
1.121 |
0.037 |
In comparison to simulations, the state of the m2 significantly longer than m1 did not have significantly higher δ values than expected from Brownian motion (p = 0.061), but did have a proportion of tips with a single state greater than any observed value in simulation (p < 2.2 * 10-16). The state of m3 significantly longer than m2 could not be statistically tested because it was completely invariant across our observed tips, where all third lower molars were significantly longer than second lower molars. The state of the M2 significantly longer than M1 did not have significantly higher δ values than expected from Brownian motion (p = 0.204), but did have a significantly greater proportion of tips with a single state (p = 0.002). The state of the M3 significantly longer than M2 was similar (p = 0.195, p = 0.004, respectively).
Case study.—Phylogenetic inertia results overall supported the application of a phylogenetic bracket to lower molar proportions of Meroehyrax kyongoi. In this case, we considered it valid to assume that molar length and relative trigonid width increases along the tooth row, even without observations of any associated molars. Prior locus identifications of isolated molars of Meroehyrax kyongoi were also consistent with an overall pattern of increasing relative trigonid widths along with relative lengths (Fig. 8), consistent with statistical analyses of fit of hyracoids to ascending models of tooth length (Table 7). As a case study of how prior analyses might be used to draw inferences about tooth positions of isolated specimens, the following results necessarily include some inferences that would go in a Discussion section in another context. Notably, two associated pairs of specimens match the pattern of directionality expected from other, better known species of hyracoids (KNM-NW 22547A and KNM-NW 22547B, KNM-NW18249 respectively). These three specimens must each be an m1 and m2 because none has the enlarged hypoconulid of an m3 (Rasmussen and Gutierrez 2009). Based on those inferred positions, the only way to designate non-overlapping clusters corresponding to published identifications of m1s and m2s would require a wide distribution of m2 relative trigonid widths. However, if KNM-NW 22554C were re-identified as an m1 then ranges of trait values would match other species of hyracoids more closely. If two specimens, KNM-NW 22549A (a left molar) and KNM-NW 22549G (a right molar), are associated, their proportions relative to one another make it more likely that KNM-NW 22549G is an m2, rather than an m1 as originally designated (Rasmussen and Gutierrez 2009). Other inferred designations are consistent with published designations.
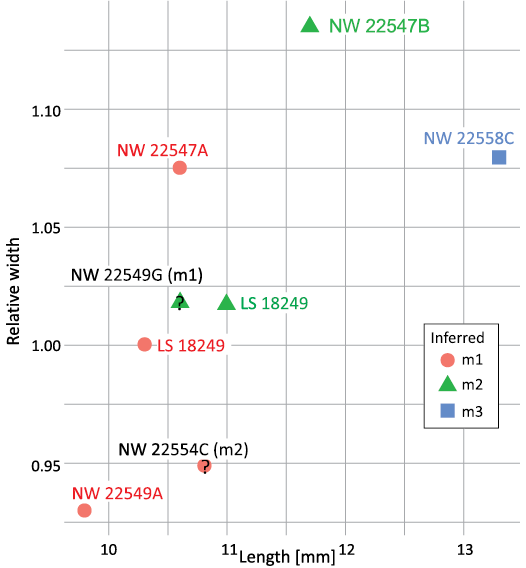
Fig. 8. Overlap in potentially diagnostic trait values for a case study of isolated molars of Meroehyrax kyongoi. In contrast to Fig. 4, molar locus identifications are based on occupation of space in this scatterplot. Question marks are overlaid over two specimens whose inferred tooth position conflicts with published diagnoses. In parentheses original identification in publication.
Discussion
In a prior work, unpublished eigensurface analyses contained significant differences between the shapes of upper molar tooth positions of hyracoids (Barrow et al. 2008; Barrow 2011). Although the goals, methods, and overall results were more focused on differentiating species while accounting for meristic variation, the result that upper molar tooth positions have distinctive morphology contrasts with the results of this study. In this study, we find that traits useful for discriminating between lower molar tooth positions do not discriminate between upper molar positions as well, indicating that either the shape underlying previously published results corresponds to different traits, or that statistical differences in mean shapes is accompanied by wide, overlapping variances that prevent consistent diagnosibility. The overlap in values between some specimens also match prior observations that tooth loci overlap to some extent in their morphology (Pickford 1994). For the remainder of the discussion, we focus on lower molar tooth positions that could be better discriminated.
As expected, no single set of values proved diagnostic for tooth loci across Hyracoidea. However, the presence of differences and the directionality of differences was largely maintained and significance of those differences between at least one pair of loci was common. The exceptions to directionality of differences were found in 7% of the 30 taxa sampled, depending on how results are interpreted. For molar relative length, Seggeurius amourensis and Procavia pliocenica did not follow an ascending-descending pattern in the lower molar arcade. We suggest that the aberrant m2 value for Seggeurius amourensis reported by Court and Mahboubi (1993) is an error. Visually, the m2 appears intermediate in length between the m1 and m3, contrary to published measurements (Court and Mahboubi 1993: fig. 4). Results for P. pliocenica can be more confidently interpreted biologically. Procavia pliocenica follows a model in which molars become progressively smaller down the molar field rather than larger, but it also has some of the smallest average differences between molar locus sizes of any of the recorded taxa, indicating that the loci differ very little from each other in either direction (Table 7). Procavia is also remarkable within Hyracoidea as having a derived molar morphology lacking clear hypoconulids on its third molars.
The presence and directionality of differences between loci in certain trait values is conserved across most of the taxa sampled. It is those relative differences, as opposed to absolute cut-off values, that we consider diagnostic and useful in future studies. Our hypothesis of phylogenetic retention in the trait of loci following an ascending-descending increase model, but not in the trait of following a specific set of trait values, is supported by phylogenetic comparative methods to the extent that current methods allow. Consistent with results of a significant interaction effect between locus and species in ANOVAs, specific ratio values are not static across the tree but instead show phylogenetic signal. It is to be expected that cut-off values for differentiating loci will differ between taxa, because the exact relationships between loci evolve. Even within genera, cut-off values may be species-specific (Rasmussen and Gutierrez 2009). Unfortunately, the behavior of δ values under models of phylogenetic retention, including the apparently non-normal distribution of results, means that using δ alone to test for significant differences between a phylogenetic signal model and phylogenetic retention model is uninformative.
However, we note two observations from our simulations. First, our observed δ values were consistent with a phylogenetic retention model, even when they could not be statistically differentiated from other models. Second, the proportion of tips with the same trait value was significantly different from our null hypothesis, supporting the phylogenetic retention hypothesis. Although the results of our simulation do not provide a way to use δ to test for phylogenetic retention, we report them here as a basis for others to potentially conduct future work refining use of the statistic and exploring its other properties.
Biologically, this conservatism in hyracoids is notable compared to other mammalian clades such as Rodentia. The two clades are inferred to have existed for roughly the same length of time (Upham et al. 2019), but rodents have explored a much larger region of developmental morphospace (Labonne et al. 2012). Even certain rodentian subfamilies, which appeared more recently than hyracoids, are more variable in their relative molar lengths (Labonne et al. 2012). Considering hyracoids in a broader evolutionary sense, not just their crown-group representatives, still does not contribute the same amount of diversity in relative tooth sizes as is found in other clades. It may be worth exploring molar field conservatism vs. lability more broadly in other mammals.
The consistency of directional relationships between lower molar locus traits and the high classification accuracy of those traits for a majority of species tested supports their use as potential tools to differentiate otherwise indistinguishable tooth positions, particularly the m1 and m2. These results suggest that multiple traits should be used together, rather than relying on a single trait for diagnosis. In new or understudied taxa where specific ratios are not known, future researchers can infer that isolated lower molars that are longer and have narrower talonids relative to other, similar looking molars in the sample may represent more distal loci of the same species. There is some overlap between loci, and therefore we acknowledge that certain isolated teeth with trait values in intermediate ranges may remain impossible to unambiguously identify to a specific position. However, based on our results we expect that the position of many specimens can be resolved. The consistency also supports the utility of phylogenetic bracketing within Hyracoidea. We acknowledge that this use of a phylogenetic bracket to make assumptions about differences between loci within a clade is not necessarily novel. We think it likely that many paleontologists use this reasoning implicitly. However, identifying isolated teeth is a research step conducive to contention because of its uncertainty. For that reason, making assumptions explicit may clarify sources and treatment of uncertainty, improving the reproducibility and making disagreements about identification more productive.
Overall, in the case study of Meroehyrax kyongoi, the inferred positions based on relative lengths and relative trigonid widths are congruent with those that were made using the aid of an additional specimen with all three associated molars (Rasmussen and Gutierrez 2009). This result may not at first appear to advance knowledge because it only partially replicates what was already known, rather than presenting a completely new set of identifications. However, its improvement comes from the observation that consistent results could be obtained even in the absence of a more complete specimen preserving all three associated. It also provides an additional perspective on evidence for identifying the locus position of isolated teeth. In the case study, this additional evidence suggests an alternative tooth position for two specimens. Images of those two specimens have not been published, and with no additional published data, there is not yet a way to choose between the hypothesized positions presented here and the published hypothesis of tooth position.
The case study also allows us to illustrate ways in which our proposed identification traits could be incorporated into a fossil identification workflow. The first step, before trying to identify teeth to a specific molar locus, would be to categorize teeth into broader groups. Specifically, the goal of the first step is to identify whether teeth belong to the molar field at all or to other dental fields, then identify coarse categories of morphotypes. Coarse categories may correspond to genera or higher clades, although there is no reason they must correspond to monophyletic groups. For an example within Hyracoidea, identifying a group of Thryohyrax- or Saghatherium-like molars might be the endpoint of this first round of classification. In the case of M. kyongi, it is important to note that the first step was already completed for us. As an alternative example, had our case study been the two species of Thyrohyrax from Losodok and Nakwai (Rasmussen and Gutierrez 2009), we might have categorized them together without trying to separate into species at this first step. This step is complete when clear, discrete traits like those that can be used in a phylogenetic analysis are no longer useful for further subdividing the sample. The next step would be to take diagnostic measurements, such as tooth lengths and relative trigonid widths, then plot them in a scatterplot like those in this study. Importantly, identification work is not complete simply by inferring tooth locus or additional subdivisions of the dataset from apparent clusters alone. Potential groups of specimens should be re-examined to investigate whether additional traits support the hypothesis that the cluster is a single, coherent biological unit or the alternative hypothesis that specimens should be grouped in other ways. All lines of evidence, both qualitative and quantitative, should be presented as evidence for a final designation of tooth identity. From there, additional work may be conducted to determine if multiple species exist within a coarse morphotype, and then whether all potential species are represented by all tooth positions. It is important to note that this last part of the process is likely to be iterative and non-linear. The process of comparative morphology and identification is inextricable from the process of developing perceptual expertise (Gibson and Gibson 1955). As such, the inherent feedback between the steps of collecting observations about a set of specimens, then using that information to learn to perceive additional observations means that no simple, short set of steps can guarantee a complete solution to identification problems.
Acknowledgements
Thanks to Steven Heritage, Matthew Borths, Catherine Riddle at the Duke Lemur Center Museum of Natural History (DPC) for assistance with CT-scanning and access to both physical specimens and their digital copies in their care. Thanks to Nicholas Rutig (Stony Brook University, USA) for assistance with post-processing scans. Thanks to Tingran Gao (University of Chicago, USA) for adjusting the PuenteAlignment code to work on Stony Brook’s computing cluster, even if those analyses did not enter into the final manuscript. Thanks to Erik Seiffert (Keck School of Medicine, University of Southern California, Los Angeles, USA), Fred Bookstein (University of Washington, USA), Jonathan Calede (Ohio State University, Marion, USA), Don de Blieux (Utah Geological Survey, Salt Lake City, USA) and two anonymous reviewers for helpful comments that improved the manuscript at various stages. This is Duke Lemur Center publication #1558.
References
Asher, R.J., Gunnell, G.F., Seiffert, E.R., Pattinson, D., Tabuce, R., Hautier, L., and Sallam, H.M. 2017. Dental eruption and growth in Hyracoidea (Mammalia, Afrotheria). Journal of Vertebrate Paleontology 37 (3): e1317638. Crossref
Bader, R.S. 1965. Heritability of dental characters in the house mouse. Evolution 19: 378–384. Crossref
Badgley, C. 1986. Taphonomy of mammalian fossil remains from Siwalik rocks of Pakistan. Paleobiology 12: 119–142. Crossref
Barrow, E.C. 2011. Systematics and Functional Morphology of Fossil and Extant Hyracoidea. 303 pp. Ph.D. Dissertation, Oxford University, Oxford.
Barrow, E.C., MacLeod, N., and Krieger, J. 2008. The quantitative comparison of hyracoid tooth geometry. Journal of Vertebrate Paleontology 28 (Supplement 003): 48A.
Barrow, E., Seiffert, E.R., and Simons, E.L. 2010. A primitive hyracoid (Mammalia, Paenungulata) from the early Priabonian (Late Eocene) of Egypt. Journal of Systematic Palaeontology 8: 213–244. Crossref
Barrow, E.C., Seiffert, E.R., and Simons, E.L. 2012. Cranial morphology of Thyrohyrax domorictus (Mammalia, Hyracoidea) from the early Oligocene of Egypt. Journal of Vertebrate Paleontology 32: 166–179. Crossref
Benazzi, S., Coquerelle, M., Fiorenza, L., Bookstein, F., Katina, S., and Kullmer, O. 2011. Comparison of dental measurement systems for taxonomic assignment of first molars. American Journal of Physical Anthropology 144: 342–354. Crossref
Bender, R. and Lange, S. 2001. Adjusting for multiple testing—when and how? Journal of Clinical Epidemiology 54: 343–349. Crossref
Benjamini, Y. and Hochberg, Y. 1995. Controlling the false discovery rate: a practical and powerful approach to multiple testing. Journal of the Royal Statistical Society. Series B (Methodological) 57: 289–300. Crossref
Bever, G.S. 2005. Morphometric variation in the cranium, mandible, and dentition of Canis latrans and Canis lepophagus (Carnivora: Canidae) and its implications for the identification of isolated fossil specimens. The Southwestern Naturalist 50: 42–56. Crossref
Blomberg, S.P., Garland, T., and Ives, A.R. 2003. Testing for phylogenetic signal in comparative data: behavior traits are more labile. Evolution 57: 717–745. Crossref
Böhmer, C., Rauhut, O.W.M., and Wörheide, G. 2015. Correlation between Hox code and vertebral morphology in archosaurs. Proceedings of the Royal Society B: Biological Sciences 282 (1810): 20150077. Crossref
Bookstein, F.L. 2018. A Course in Morphometrics for Biologists: Geometry and Statistics for Studies of Organismal Form. 527 pp. Cambridge University Press, Cambridge. Crossref
Borges, R., Machado, J.P., Gomes, C., Rocha, A.P., and Antunes, A. 2019. Measuring phylogenetic signal between categorical traits and phylogenies. Bioinformatics 35: 1862–1869. Crossref
Borths, M.R. and Stevens, N.J. 2019. Taxonomic affinities of the enigmatic Prionogale breviceps, early Miocene, Kenya. Historical Biology 31: 784–793. Crossref
Boyer, D.M. 2008. Relief index of second mandibular molars is a correlate of diet among prosimian primates and other euarchontan mammals. Journal of Human Evolution 55: 1118–1137. Crossref
Boyer, D.M., Gunnell, G.F., Kaufman, S., and McGeary, T.M. 2016. MorphoSource: archiving and sharing 3-D digital specimen data. The Paleontological Society Papers 22: 157–181. Crossref
Butler, P.M. 1937. Studies of the mammalian dentition. I. The teeth of Centetes ecaudatus and its allies. Proceedings of the Zoological Society of London B107: 103–132. Crossref
Butler, P.M. 1939. Studies of the mammalian dentition. Differentiation of the post-canine dentition. Proceedings of the Zoological Society of London 109: 1–36. Crossref
Calede, J.J.M. and Glusman, J.W. 2017. Geometric morphometric analyses of worn cheek teeth help identify extant and extinct gophers (Rodentia, Geomyidae). Palaeontology 60: 281–307. Crossref
Cassiliano, M. 1997. Taphonomy of mammalian fossils across the Blancan-Irvingtonian boundary: Palm Spring Formation, Anza-Borrego desert of southern California. Palaeogeography, Palaeoclimatology, Palaeoecology 129: 81–108. Crossref
Castiglione, S., Serio, C., Piccolo, M., Mondanaro, A., Melchionna, M., Di Febbraro, M., Sansalone, G., Wroe, S., and Raia, P. 2021. The influence of domestication, insularity and sociality on the tempo and mode of brain size evolution in mammals. Biological Journal of the Linnean Society 132: 221–231. Crossref
Chicco, D. 2017. Ten quick tips for machine learning in computational biology. BioData Mining 10 (1): 35. Crossref
Cignoni, P., Callieri, M., Corsini, M., Dellepiane, M., Ganovelli, F., and Ranzuglia, G. 2008. MeshLab: an Open-Source Mesh Processing Tool. In: V. Scarano, R De Chiara, and U. Erra (eds.), Eurographics Italian Chapter Conference, 129–136. Eurographics, Salerno
Clemens, Jr., W.A. 1966. Fossil mammals of the type Lance Formation Wyoming. Part II. Marsupialia. University of California Publications in Geological Sciences 62: 1–122.
Cooper, L.N., Seiffert, E.R., Clementz, M., Madar, S.I., Bajpai, S., Hussain, S.T., and Thewissen, J.G.M. 2014. Anthracobunids from the Middle Eocene of India and Pakistan are stem perissodactyls. PLoS ONE 9 (10): e109232. Crossref
Cooper, N., Jetz, W., and Freckleton, R.P. 2010. Phylogenetic comparative approaches for studying niche conservatism. Journal of Evolutionary Biology 23: 2529–2539. Crossref
Coster, P., Benammi, M., Mahboubi, M., Tabuce, R., Adaci, M., Marivaux, L., Bensalah, M., Mahboubi, S., Mahboubi, A., Mebrouk, F., Maameri, C., and Jaeger, J.-J. 2012. Chronology of the Eocene continental deposits of Africa: Magnetostratigraphy and biostratigraphy of the El Kohol and Glib Zegdou Formations, Algeria. Geological Society of America Bulletin 124: 1590–1606. Crossref
Cote, S., Kingston, J., Deino, A., Winkler, A., Kityo, R., and MacLatchy, L. 2018. Evidence for rapid faunal change in the early Miocene of East Africa based on revised biostratigraphic and radiometric dating of Bukwa, Uganda. Journal of Human Evolution 116: 95–107. Crossref
Court, N. and Mahboubi, M. 1993. Reassessment of Lower Eocene Seggeurius amourensis : aspects of primitive dental morphology in the mammalian order Hyracoidea. Journal of Paleontology 67: 889–893. Crossref
Cuvier, G. 2009. Discourse on the Revolutionary Upheavals on the Surface of the Globe and on the Changes Which They Have Produced in the Animal Kingdom (Original work published 1825). 150 pp. Richer Resources, Arlington, Virginia.
Drake, R.E., Van Couvering, J.A., Pickford, M.H., Curtis, G.H., and Harris, J.A. 1988. New chronology for the Early Miocene mammalian faunas of Kisingiri, Western Kenya. Journal of the Geological Society 145: 479–491. Crossref
Engelman, R. and Croft, D. 2022. Identifying tooth position of isolated teeth of sparassodonts (Mammalia: Metatheria) using geometric morphometrics. Palaeontologia Electronica 25 (1): a8.
Feibel, C.S. and Brown, F.H. 1991. Age of the primate-bearing deposits on Maboko Island, Kenya. Journal of Human Evolution 21: 221–225. Crossref
Fortelius, M. 1985. Ungulate cheek teeth: developmental, functional, and evolutionary interrelations. Acta Zoologica Fennica 180: 1–76.
Fritz, S.A. and Purvis, A. 2010. Selectivity in mammalian extinction risk and threat types: a new measure of phylogenetic signal strength in binary traits. Conservation Biology 24: 1042–1051. Crossref
Gheerbrant, E., Filippo, A., and Schmitt, A. 2016. Convergence of afrotherian and laurasiatherian ungulate-like mammals: first morphological evidence from the Paleocene of Morocco. PLOS ONE 11 (7): e0157556. Crossref
Gibson, J.J. and Gibson, E.J. 1955. Perceptual learning: differentiation or enrichment? Psychological Review 62: 32–41. Crossref
Gingerich, P.D. and Schoeninger, M.J. 1979. Patterns of tooth size variability in the dentition of Primates. American Journal of Physical Anthropology 51: 457–466. Crossref
Gómez-Robles, A. and Polly, P.D. 2012. Morphological integration in the hominin dentition: evolutionary, developmental, and functional factors. Evolution 66: 1024–1043. Crossref
Gutzwiller, S.C. and Hunter, J.P. 2015. Evolution and function of the upper molar talon and its dietary implications in microbats. Journal of Morphology 276: 1368–1376. Crossref
Head, J.J. and Polly, P.D. 2015. Evolution of the snake body form reveals homoplasy in amniote Hox gene function. Nature 520: 86–89. Crossref
Heritage, S. and Seiffert, E.R. 2022. Total evidence time-scaled phylogenetic and biogeographic models for the evolution of sea cows (Sirenia, Afrotheria). PeerJ 10: e13886.
Heritage, S., Seiffert, E.R., and Borths, M.R. 2021. Recommended Fossil Calibrators For Time-scaled Molecular Phylogenies of Afrotheria. Dryad [available online, https://doi.org/10.5061/dryad.83bk3j9s2]
Janis, C.M. 1979. Mastication in the hyrax and its relevance to ungulate dental evolution. Paleobiology 5: 50–59. Crossref
Janis, C.M. 1990. Correlation of cranial and dental variables with body size in ungulates and macropodids. In: J. Damuth and B.J. MacFadden (eds.), Body Size in Mammalian Paleobiology: Estimation and Biological Implications, 255–299. Cambridge University Press, Cambridge.
Jaynes, E.T. and Bretthorst, G.L. 2003. Probability Theory: the Logic of Science. 727 pp. Cambridge University Press, Cambridge. Crossref
Jones, K.E., Angielczyk, K.D., Polly, P.D., Head, J.J., Fernandez, V., Lungmus, J.K., Tulga, S., and Pierce, S.E. 2018. Fossils reveal the complex evolutionary history of the mammalian regionalized spine. Science 361: 1249–1252. Crossref
Kavanagh, K.D., Evans, A.R., and Jernvall, J. 2007. Predicting evolutionary patterns of mammalian teeth from development. Nature 449: 427–432. Crossref
Kimura, Y., Jacobs, L.L., and Flynn, L.J. 2013. Lineage-specific responses of tooth shape in murine rodents (Murinae, Rodentia) to late Miocene dietary change in the Siwaliks of Pakistan. PLoS ONE 8 (10): e76070. Crossref
Kondo, S., Hanamura, H., and Wakatsuki, E. 1994. Crown dimensions of the maxillary molars in Tupaia glis. Okajimas Folia Anatomica Japonica 70 (6): 261–265. Crossref
Korth, W.W. 1979. Taphonomy of microvertebrate fossil assemblages. Annals of Carnegie Museum 48: 235–285. Crossref
Kuhn, M. and Johnson, K. 2013. Applied Predictive Modeling. Springer, New York. Crossref
Labonne, G., Laffont, R., Renvoise, E., Jebrane, A., Labruere, C., Chateau-Smith, C., Navarro, N., and Montuire, S. 2012. When less means more: evolutionary and developmental hypotheses in rodent molars. Journal of Evolutionary Biology 25: 2102–2111. Crossref
Leakey, M., Grossman, A., Gutiérrez, M., and Fleagle, J.G. 2011. Faunal change in the Turkana Basin during the Late Oligocene and Miocene. Evolutionary Anthropology: Issues, News, and Reviews 20 (6): 238–253. Crossref
Marshall, P.M. and Butler, P.M. 1966. Molar cusp development in the bat, Hipposideros beatus, with reference to the ontogenetic basis of occlusion. Archives of Oral Biology 11 (10): 949-IN1. Crossref
Matsumoto, H. 1921. Megalohyrax Andrews and Titanohyrax, g.n. A revision of the genera of hyracoids from the Fayûm, Egypt. Proceedings of the Zoological Society of London 91: 839–850. Crossref
Matsumoto, H. 1926. Contribution to the knowledge of the fossil Hyracoidea of the Fayûm, Egypt, with description of several new species. Bulletin of the American Museum of Natural History 56: 253–350.
Meyer, G.E. 1973. A new Oligocene hyrax from the Jebel el Quatrani Formation, Fayum, Egypt. Postilla 163: 1–11.
Miller, E.H., Mahoney, S.P., Kennedy, M.L., and Kennedy, P.K. 2009. Variation, sexual dimorphism, and allometry in molar size of the black bear. Journal of Mammalogy 90: 491–503. Crossref
Naylor, G.J.P. and Marcus, L.F. 1994. Identifying isolated shark teeth of the genus Carcharhinus to species: relevance for tracking phyletic change through the fossil record. American Museum Novitates 3109: 1–53.
Novacek, M.J., Bown, T.M., and Schankler, D. 1985. On the classification of the early Tertiary Erinaceomorpha (Insectivora, Mammalia). American Museum Novitates 2813: 1–22.
Pickford, M. 1994. A new species of Prohyrax (Mammalia, Hyracoidea) from the middle Miocene of Arrisdrift, Namibia. Communications of the Geological Survey of Namibia 9: 43–62.
Pickford, M. 2005. Fossil hyraxes (Hyracoidea: Mammalia) from the Late Miocene and Plio-Pleistocene of Africa, and the phylogeny of the Procaviidae. Palaeontologia Africana 41: 141–162.
Pickford, M. 2009. New Neogene hyracoid specimens from the Peri-Tethys region and East Africa. Paleontological Research 13: 265–278. Crossref
Pickford, M. and Senut, B. 2018. Afrohyrax namibensis (Hyracoidea, Mammalia) from the Early Miocene of Elisabethfeld and Fiskus, Sperrgebiet, Namibia. Communications of the Geological Survey of Namibia 18: 93–112.
Pickford, M., Senut, B., Morales, J., Mein, P., and Sanchez, I.M. 2008. Mammalia from the Lutetian of Namibia. Memoirs of the Geological Survey of Namibia 20: 465–514.
Pickford, M., Thomas, H., Sen, S., Roger, J., Gheerbrant, E., and Al-Sulaimani, Z. 1994. Early Oligocene hyracoids (Mammalia) from Thaytiniti and Taqah, Dhofar Province, Sultanate of Oman. Comptes rendus de L’Academie des sciences, Serie II a, Sciences de la terre et des planetes 318: 1395–1400.
Polly, P.D. 2003. Paleophylogeography: the tempo of geographic differentiation in marmots (Marmota). Journal of Mammalogy 84: 369–284. Crossref
Polly, P.D. 2007. Development with a bite. Nature 449: 413–415. Crossref
Polly, P.D. and Head, J.J. 2004. Maximum-likelihood identification of fossils: taxonomic identification of Quaternary marmots (Rodentia, Mammalia) and identification of vertebral position in the pipesnake Cylindrophis (Serpentes, Reptilia). In: A.M.T. Elew (ed.), Morphometrics: Applications in Biology and Paleontology, 197–221. Springer, Berlin. Crossref
Polly, P.D. and Mock, O.B. 2017. Heritability: the link between development and the microevolution of molar tooth form. Historical Biology: 1–11. Crossref
R Core Team 2015. R: A Language and Environment for Statistical Computing. R Foundation for Statistical Computing, Vienna [available online, https://www.r-project.org/]
Rasmussen, D.T. and Gutierrez, M. 2009. A mammalian fauna from the Late Oligocene of Northwestern Kenya. Palaeontographica Abteilung A 288 (1–3): 1–52. Crossref
Rasmussen, D.T. and Gutierrez, M. 2010. Hyracoidea. In: L. Werdelin and W.J. Sanders (eds.), Cenozoic Mammals of Africa, 123–146. University of California Press, Berkeley. Crossref
Rasmussen, D.T. and Simons, E.L. 1988. New Oligocene hyracoids from Egypt. Journal of Vertebrate Paleontology 8: 67–83. Crossref
Rasmussen, D.T. and Simons, E.L. 1991. The oldest Egyptian hyracoids (Mammalia: Pliohyracidae): New species of Saghatheriums and Thyrohyrax from the Fayum. Neues Jahrbuch für Geologie und Paläontologie, Abhandlungen 182: 187–209. Crossref
Rasmussen, D.T. and Simons, E.L. 2000. Ecomorphological diversity among Paleogene hyracoids (Mammalia): a new cursorial browser from the Fayum, Egypt. Journal of Vertebrate Paleontology 20: 167–176. Crossref
Rasmussen, D.T., Pickford, M., Mein, P., Senut, B., and Conroy, G.C. 1996. Earliest known procaviid hyracoid from the late Miocene of Namibia. Journal of Mammalogy 77: 745–754. Crossref
Seiffert, E.R. 2006. Revised age estimates for the later Paleogene mammal faunas of Egypt and Oman. Proceedings of the National Academy of Sciences 103: 5000–5005. Crossref
Seiffert, E.R. 2007. A new estimate of afrotherian phylogeny based on simultaneous analysis of genomic, morphological, and fossil evidence. BMC Evolutionary Biology 7 (1): 224. Crossref
Stanhope, M.J., Waddell, V.G., Madsen, O., De Jong, W., Hedges, S.B., Cleven, G.C., Kao, D., and Springer, M.S. 1998. Molecular evidence for multiple origins of Insectivora and for a new order of endemic African insectivore mammals. Proceedings of the National Academy of Sciences 95: 9967–9972. Crossref
Sudre, J. 1979. Nouveaux mammifered Eocenes du Sahara occidental. Palaeovertebrata 9 (3): 83–115.
Tabuce, R. 2016. A mandible of the hyracoid mammal Titanohyrax andrewsi in the collections of the Muséum National d’Histoire Naturelle, Paris (France) with a reassessment of the species. Palaeovertebrata 40 (1): e4. Crossref
Teilhard de Chardin, P. and Licent, E. 1936. New remains of Postschizotherium from S.E. Shansi. Bulletin of the Geological Society of China 15: 421–427. Crossref
Tsujikawa, H. and Pickford, M. 2006. Additional specimens of Hyracoidea (Mammalia) from the Early and Middle Miocene of Kenya. Annales de Paléontologie 92: 1–12. Crossref
Uchida, A. 1998. Variation in tooth morphology of Gorilla gorilla. Journal of Human Evolution 34: 55–70. Crossref
Ungar, P.S. and Williamson, M. 2000. Exploring the effects of tooth wear on functional morphology: a preliminary study using dental topographic analysis. Palaeontologia Electronica 3 (1): 1–18.
Upham, N.S., Esselstyn, J.A., and Jetz, W. 2019. Inferring the mammal tree: Species-level sets of phylogenies for questions in ecology, evolution, and conservation. PLOS Biology 17 (12): e3000494. Crossref
Venables, W.N. and Ripley, B.D. 2002. Modern Applied Statistics with S. Statistics and Computing. 495 pp. Springer, New York. Crossref
Vitek, N.S., Manz, C.L., Gao, T., Bloch, J.I., and Boyer, D.M. 2017. Semi-supervised determination of pseudocryptic morphotypes using observer-free characterizations of anatomical alignment and shape. Ecology and Evolution 7: 5041–5055. Crossref
Vitek, N.S., Roseman, C.C., and Bloch, J.I. 2020. Mammal molar size ratios and the inhibitory cascade at the intraspecific scale. Integrative Organismal Biology 2: 1–17. Crossref
Walker, J.D., Geissman, J.W., Bowring, S.A., and Babcock, L.E. 2019. GSA Geologic Time Scale v. 5.0. Geological Society of America, Boulder, Colorado [available online, https://doi.org/10.1130/2018.CTS005R3C]. Crossref
Weaver, L.N., Fulghum, H.Z., Grossnickle, D.M., Brightly, W.H., Kulik, Z.T., Wilson Mantilla, G.P., and Whitney, M.R. 2022. Multituberculate mammals show evidence of a life history strategy similar to that of placentals, not marsupials. The American Naturalist 200: 383–400. Crossref
Whitworth, T. 1954. The Miocene hyracoids of East Africa, with some observations on the order Hyracoidea. Fossil Mammals of Africa 7: 1–58.
Witmer, L.M. 1995. The extant phylognetic bracket and its important in reconstructing soft tissues in fossils. In: J. Thomason (ed.), Functional Morphology in Vertebrate Paleontology, 19–33. Cambridge University Press, Cambridge.
Wood, B.A., Li, Y., and Willoughby, C. 1991. Intraspecific variation and sexual dimorphism in cranial and dental variables among higher primates and their bearing on the hominid fossil record. Journal of Anatomy 174: 185.
Yezerinac, S.M., Lougheed, S.C., and Handford, P. 1992. Measurement error and morphometric studies: statistical power and observer experience. Systematic Biology 41: 471–482. Crossref
Yom-Tov, Y. 1993. Does the rock hyrax, Procavia capensis, conform with Bergmann’s rule? Zoological Journal of the Linnean Society 108: 171–177. Crossref
Young, N.M., Winslow, B., Takkellapati, S., and Kavanagh, K. 2015. Shared rules of development predict patterns of evolution in vertebrate segmentation. Nature Communications 6 (1): 6690. Crossref
Zack, S.P. 2012. Deciduous dentition of Didymictis (Carnivoramorpha: Viverravidae): implications for the first appearance of “Creodonta”. Journal of Mammalogy 93: 808–817. Crossref
Acta Palaeontol. Pol. 69 (1): 109–126, 2024
https://doi.org/10.4202/app.01094.2023